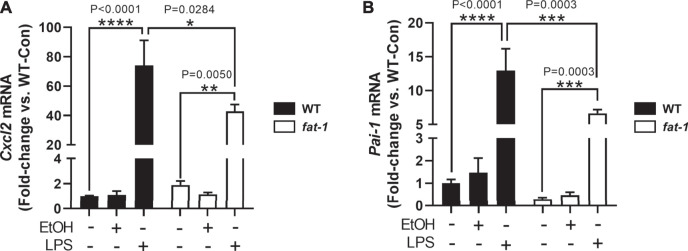
FIGURE 5.
Expression of Cxcl2 and Pai-1 in BMDMs. (A) Expression of Cxcl2 and (B) Pai-1 in EtOH and LPS-treated BMDMs isolated from WT and fat-1 mice. *p < 0.05, **p < 0.01, ***p < 0.001, ****p < 0.0001, one-way ANOVA (comparisons not significant if unlabeled). Experiment was performed twice with consistent results.

