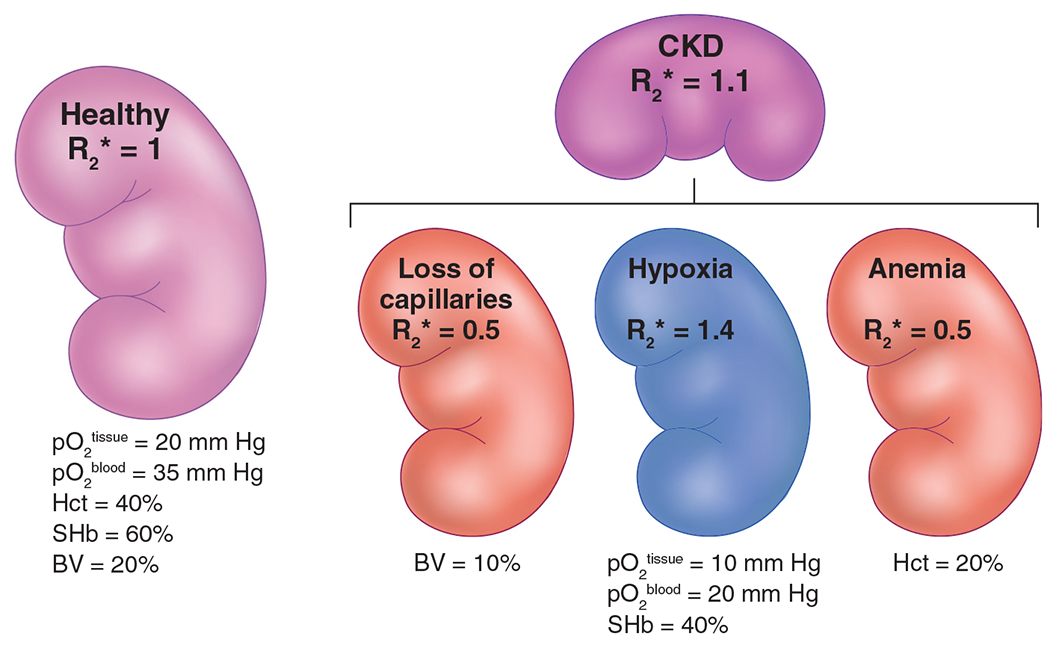
Figure 1 |. Schematic overview of the key factors that govern renal R2*.

This includes changes in renal blood pO2, hematocrit (Hct), O2 saturation of Hb (SHb), and fractional blood volume (BV). Please note that all values given here are only for illustrative purposes. R2* values were also chosen for illustrative purposes, with healthy renal R2* set at 1.0. In chronic kidney disease (CKD), along with reduced tissue and blood oxygenation, there is loss of microvasculature and anemia. The net contribution makes the R2* in CKD only slightly higher compared with healthy controls.
