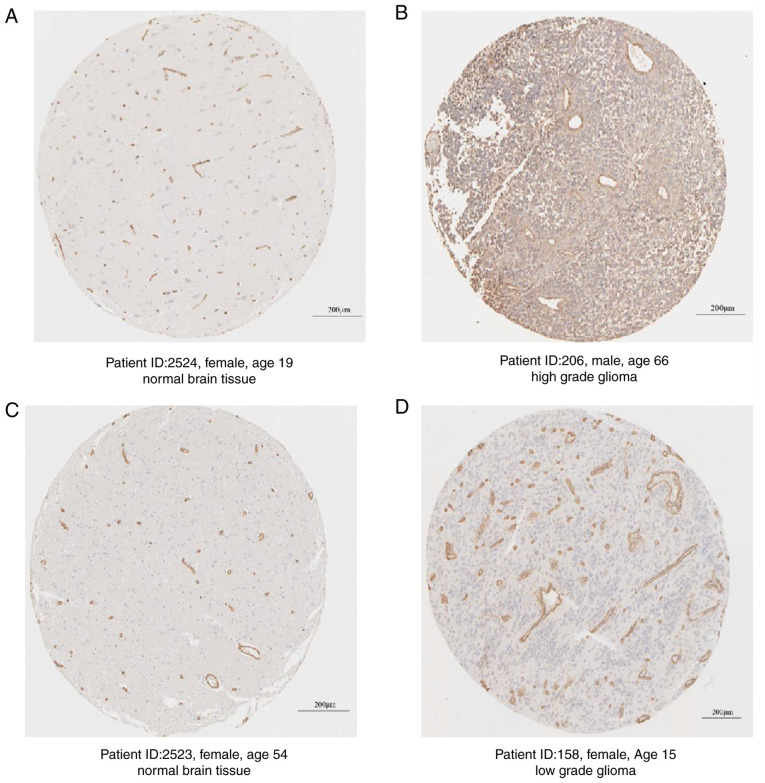
Figure 3.
Protein expression levels of COL4A1 compared between glioma tissues and normal brain tissues by immunohistochemical detection in samples from the human protein atlas. (A) Normal brain tissue; (B) high-grade glioma tissue; (C) Normal brain tissue; (D) low-grade glioma tissue. Yellow-brown areas represent positive staining results. Scale bars, 200 µm. COL4A1, collagen α-1 (IV) chain.

