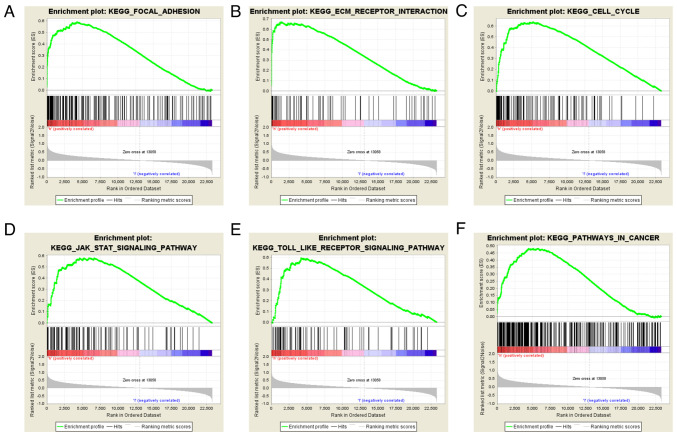
Figure 8.
Enrichment plots from the gene set enrichment analysis. (A) Focal adhesion, (B) ECM receptor interaction, (C) cell cycle, (D) JAK/STAT signaling pathway, (E) Toll-like receptor signaling pathway and (F) pathways in cancer. ECM, extracellular matrix; KEGG, Kyoto Encyclopedia of Genes and Genomes.

