FIGURE 2.

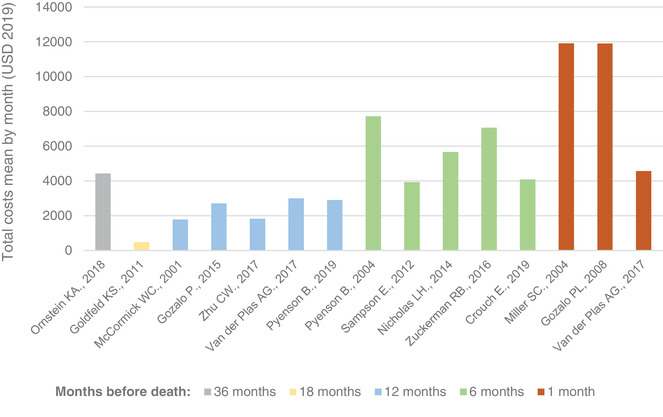
Distribution of monthly derived costs of care in studies including only direct costs of care by end‐of‐life period considered. USD, US dollars

Distribution of monthly derived costs of care in studies including only direct costs of care by end‐of‐life period considered. USD, US dollars