
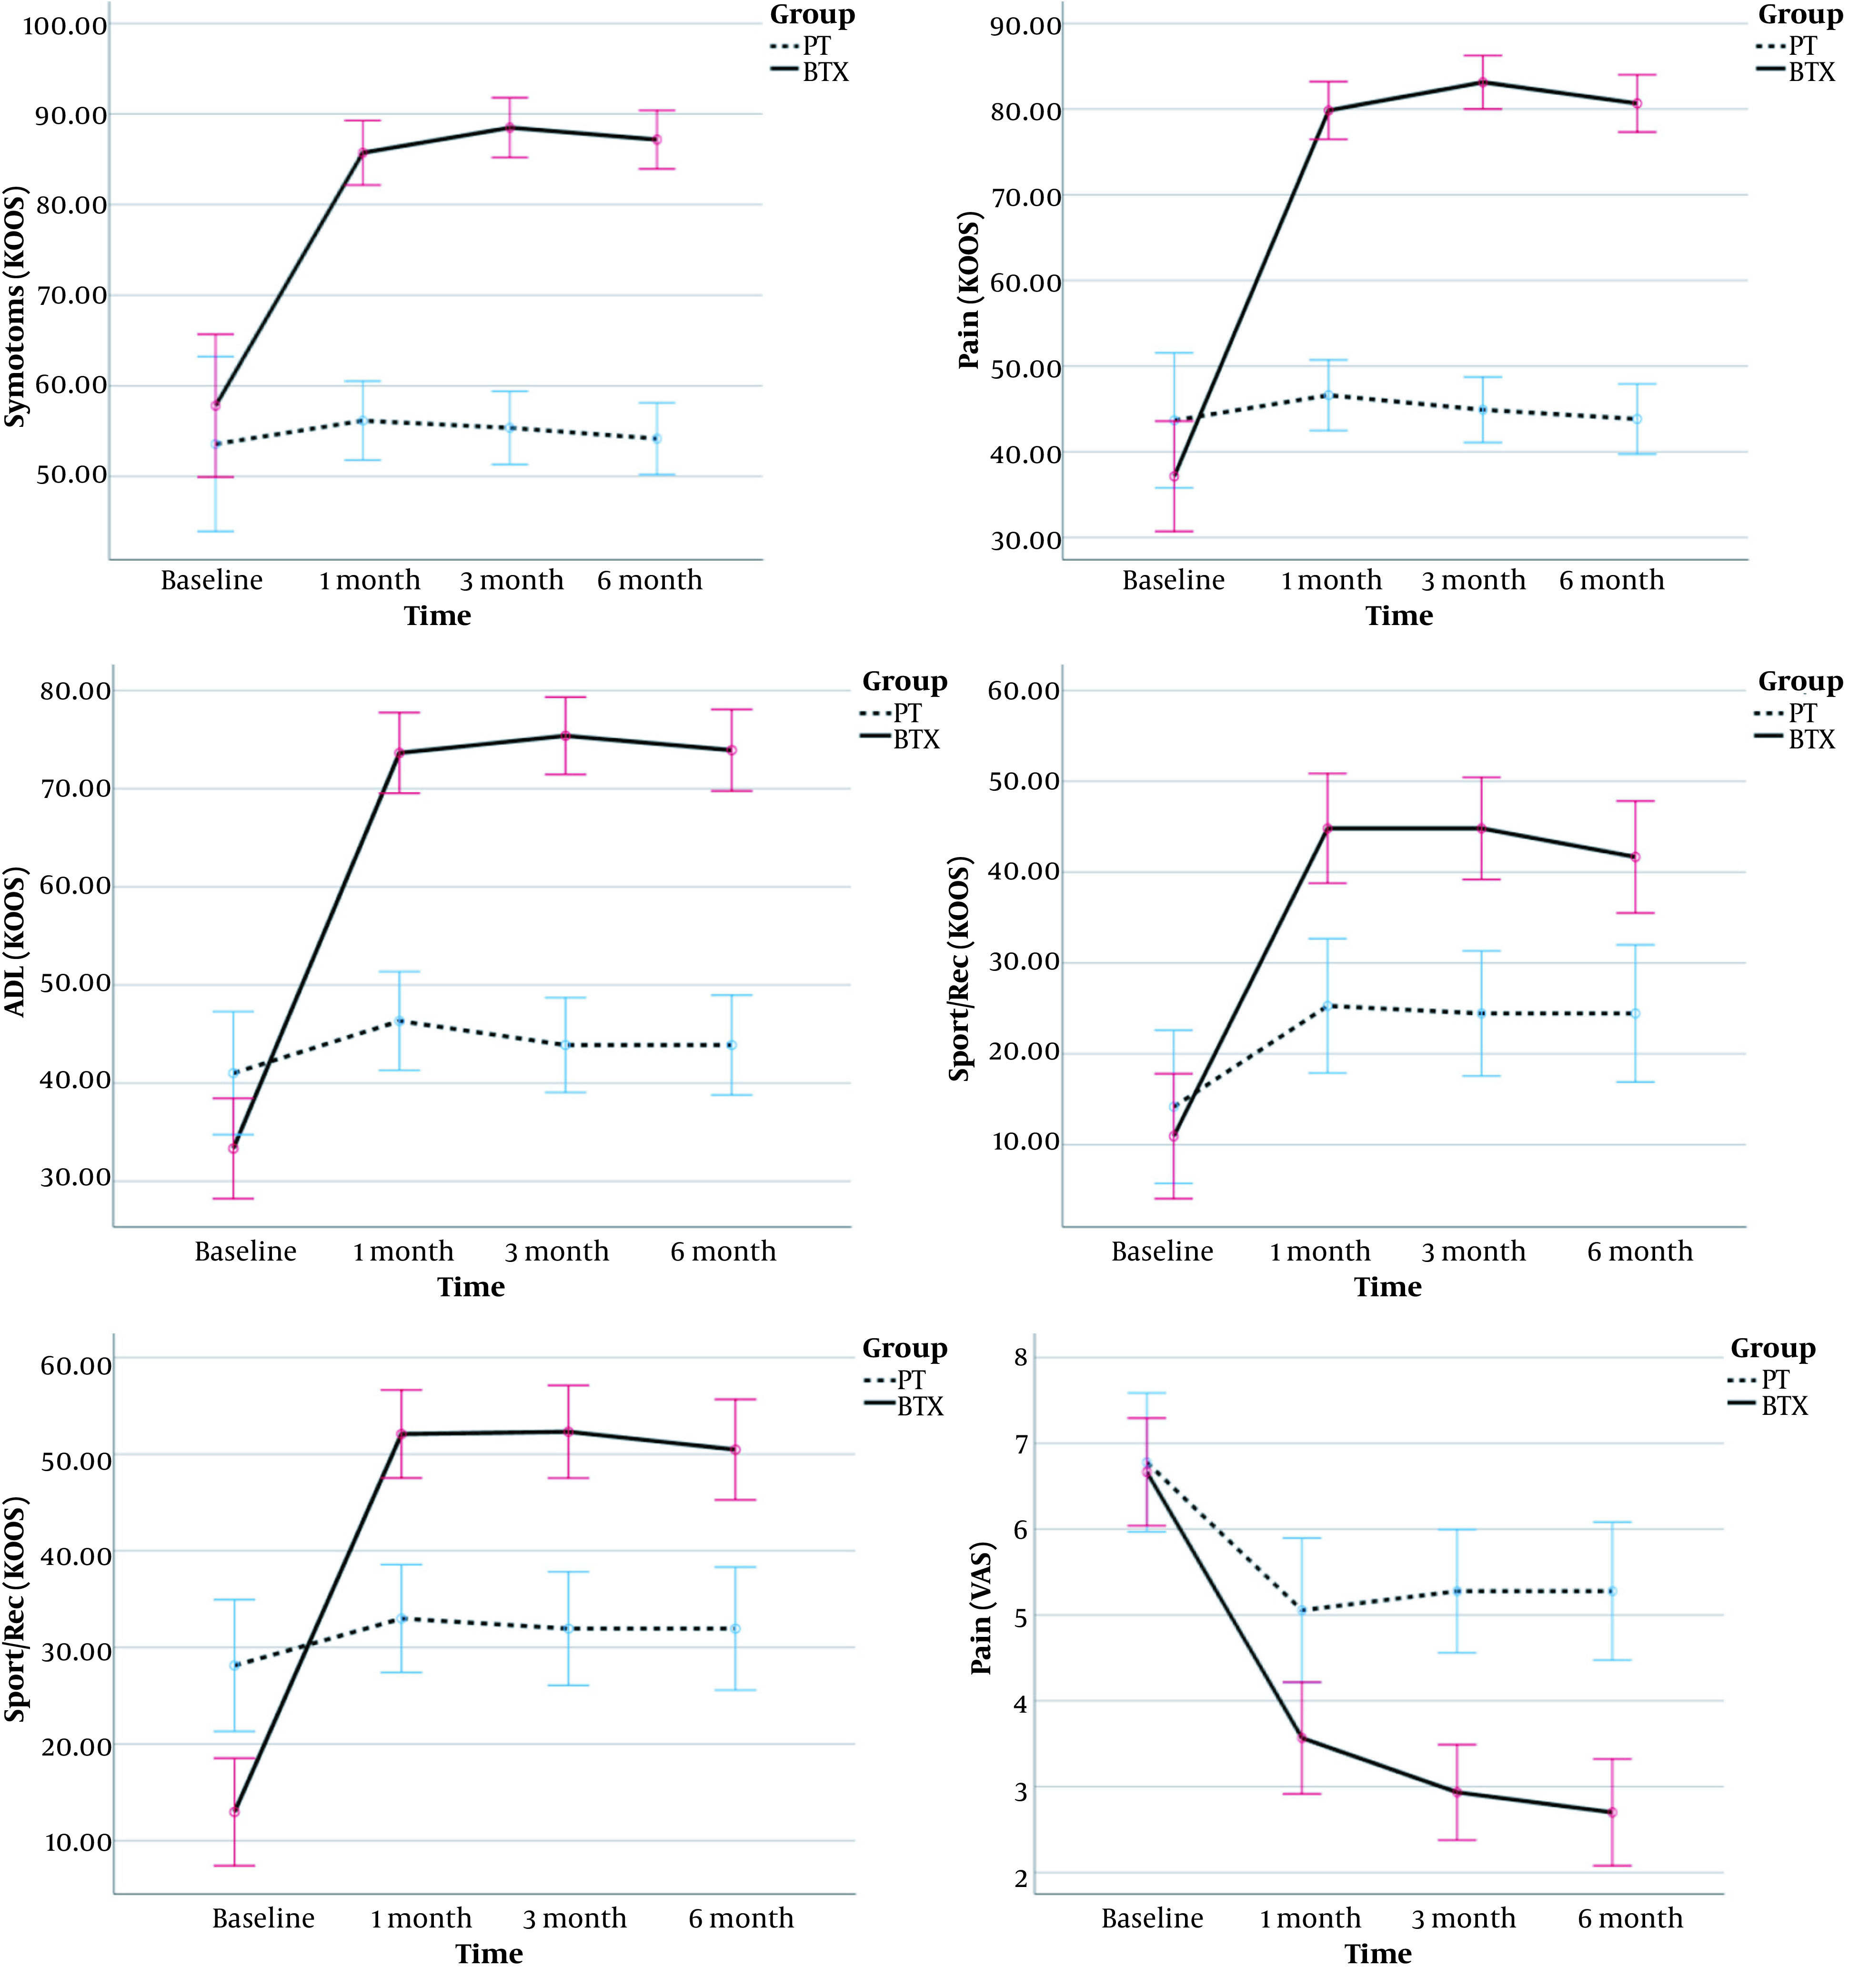
Figure 2. Comparing change of mean outcomes throughout the study between PT and BTX groups. Error bars represent the 95% CI for the outcomes.
Official websites use .gov
A
.gov website belongs to an official
government organization in the United States.
Secure .gov websites use HTTPS
A lock (
) or https:// means you've safely
connected to the .gov website. Share sensitive
information only on official, secure websites.