Figure 1.

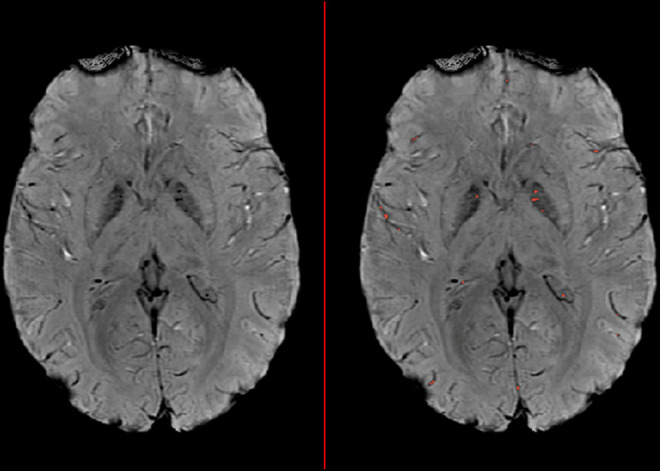
Sample susceptibility-weighted image illustrating hypointensity burden (HIB). Hypointensity clusters that pass the intensity and maximal size thresholds are highlighted in red on the right image.

Sample susceptibility-weighted image illustrating hypointensity burden (HIB). Hypointensity clusters that pass the intensity and maximal size thresholds are highlighted in red on the right image.