
Figure 1.
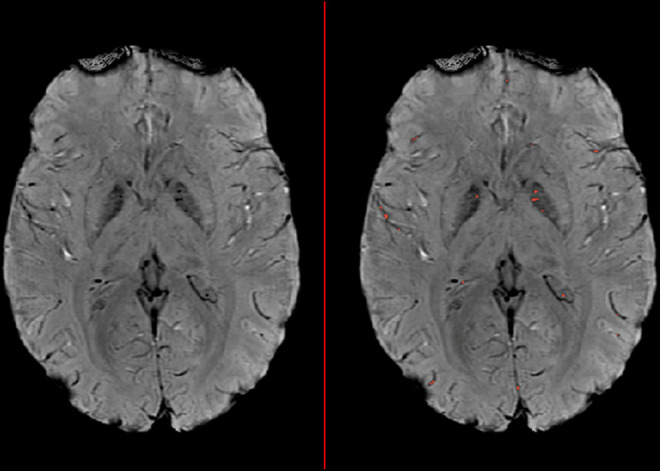
Sample susceptibility-weighted image illustrating hypointensity burden (HIB). Hypointensity clusters that pass the intensity and maximal size thresholds are highlighted in red on the right image.
Official websites use .gov
A
.gov website belongs to an official
government organization in the United States.
Secure .gov websites use HTTPS
A lock (
) or https:// means you've safely
connected to the .gov website. Share sensitive
information only on official, secure websites.
Sample susceptibility-weighted image illustrating hypointensity burden (HIB). Hypointensity clusters that pass the intensity and maximal size thresholds are highlighted in red on the right image.