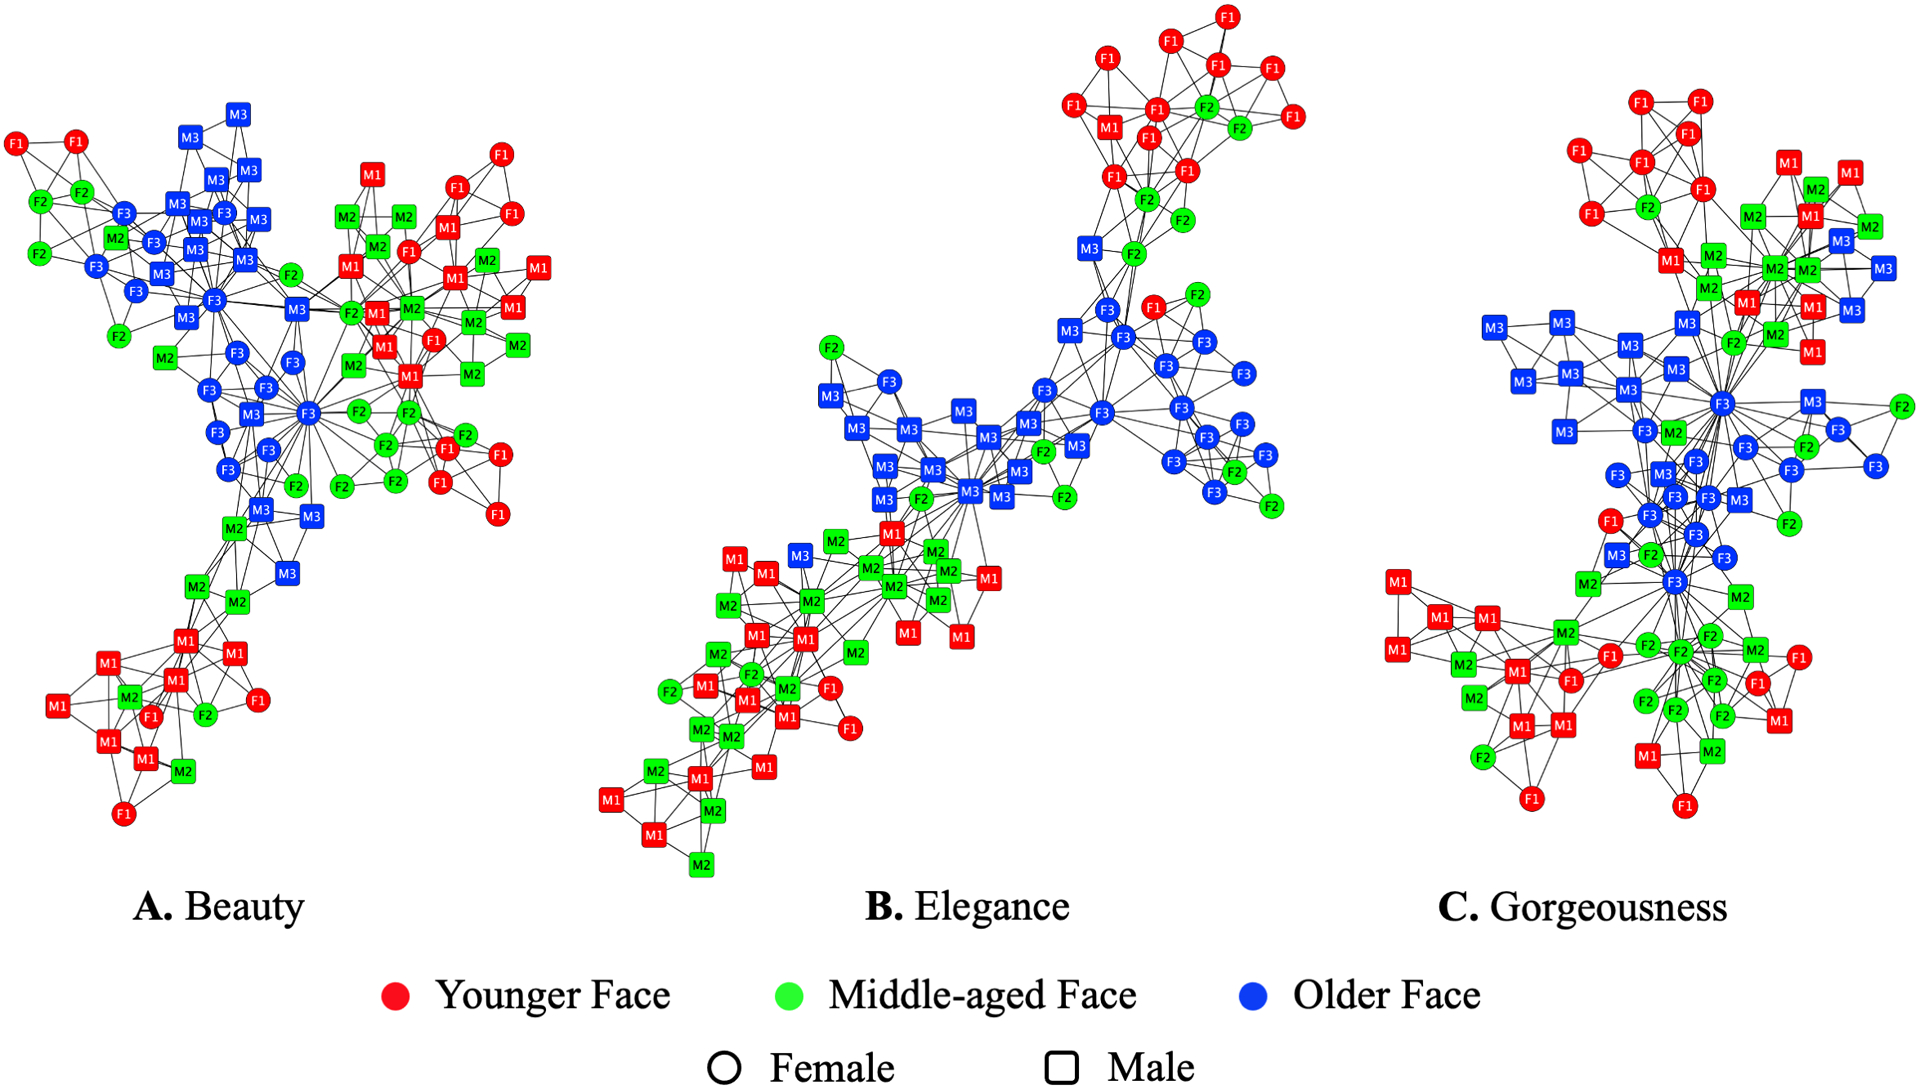
Fig. 5.

2D visualization of the dimension of attractiveness-based face preference networks. Nodes represent the 90 faces. Edges represent symmetrical, binary relations between nodes. Colors represent face age. Shapes represent face sex. Labels denote face sex and age (F1, younger female face; M1, younger male face; F2, middle-aged female face; M2, middle-aged male face; F3, older female face; M3, older male face).
