Figure 5.
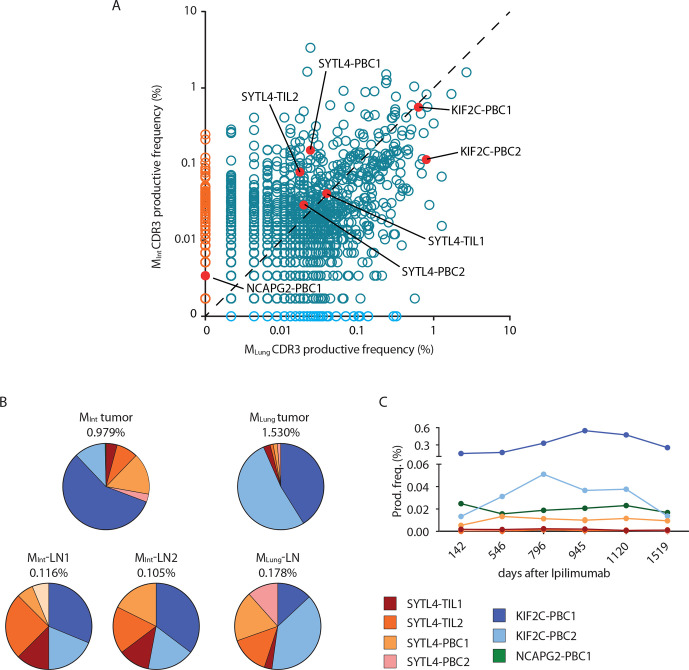
Spatial and temporal distribution of neoantigen-specific TCRs as determined by TCR-β sequencing. (A) Productive frequency of CDR3 rearrangements (amino acid) calculated as the number of sequencing templates divided by the sum of template counts for all productive rearrangements in MInt and MLung. Scatter plot dataset was generated with adaptive Biotechnologies ImmunoSEQ analysis software. (B) Distribution of neoantigen-specific TCRs in resected tumor and lymph node tissues. Percentages indicate frequency of identified neoantigen-specific TCRs in analyzed tissue repertoire as inferred from TCR-β deep sequencing data. (C) Productive frequency expressed as percentage of neoantigen-specific clonotypes in peripheral blood at different time points after first treatment with ipilimumab. TCR, T-cell receptor.

