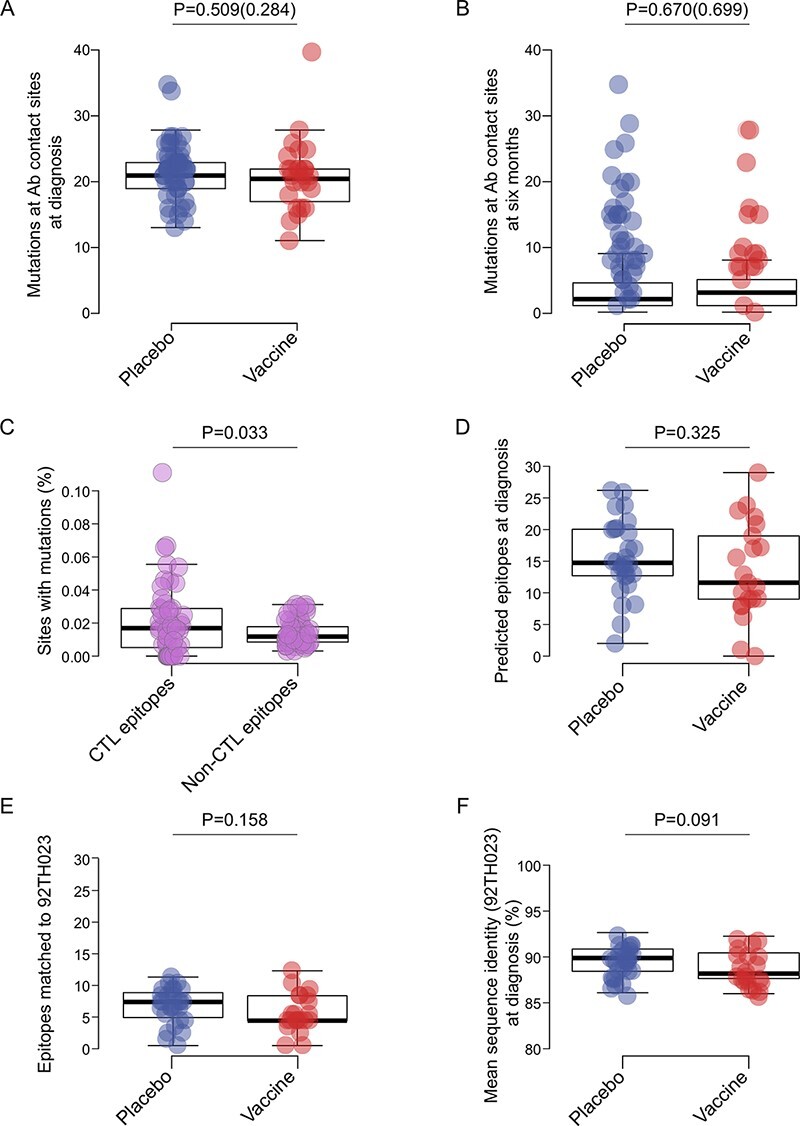
Figure 2.

Mutations at sites associated with B or T cell pressure in Env did not differ across treatment groups. The number of mutations at known Ab contact sites (n = 164) per placebo (blue) and vaccine (red) participant at (A) diagnosis when comparing sequences with the CRF01_AE consensus and (B) 6 months post-diagnosis when comparing these sequences with those sampled at diagnosis. Swarm plots show the number of mutations after correcting for differences in the number of sequences per participant. (C) The proportion of sites with mutations considering sites known as CTL epitopes and sites without CTL epitopes (data from vaccine and placebo groups combined). (D) The number of CTL epitopes predicted on sequences sampled at diagnosis in vaccine and placebo recipients. (E) The number of CTL epitopes matching CRF01_AE gp120 vaccine insert 92TH023 in vaccine and placebo recipients at diagnosis. (F) Mean sequence identity between vaccine and placebo recipients and CRF01_AE gp120 vaccine insert 92TH023. P-values are shown for pairwise Student’s t tests (parenthetical P-values show results after correcting for the number of sequences in (a and b)).
