Figure 3.

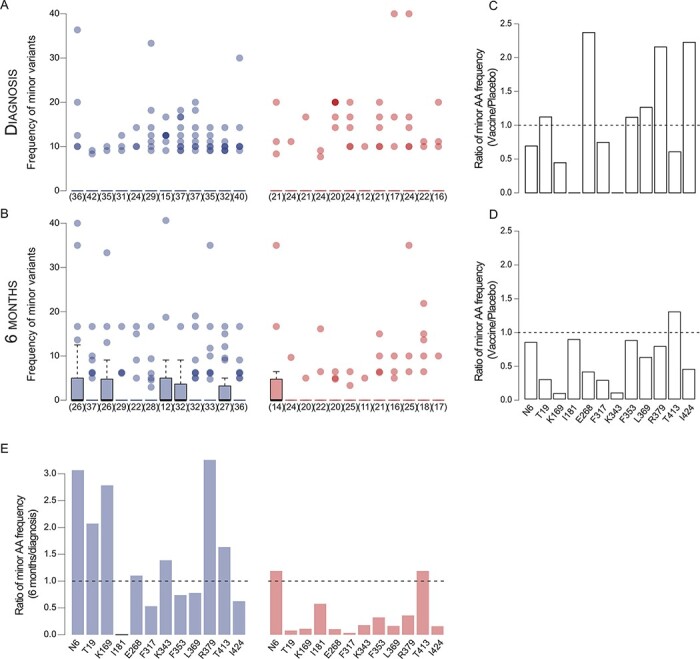
Minor variants increased at sieve signature sites in placebo but not in vaccine recipients. The percentage represented by non-consensus amino acids in vaccine (red) and placebo (blue) recipients at each signature site at (A) diagnosis and (B) 6 months post-diagnosis. This is calculated for infections where the consensus corresponding to the signature site is found in the majority of sequences from that individual; the number of participants with zero values is noted in parentheses. Median values across jackknifed samples are shown in (B). The ratio of the mean number of non-consensus (minor) amino acids per consensus-majority participant in vaccine and placebo recipients at (C) diagnosis and (D) 6 months post-diagnosis at each Env signature site. (C and D) Dashed lines indicate an equal number of non-consensus amino acids between vaccine and placebo recipients; values above the dashed line indicate a higher number in vaccinees. (E) The mean ratio of non-consensus amino acid frequencies at each signature site across sampling times in placebo and vaccine recipients. The dashed line indicates the value if there was no difference in frequencies across sampling times; values above the dashed line indicate an increase in non-consensus amino acids between diagnosis and 6 months post-diagnosis.
