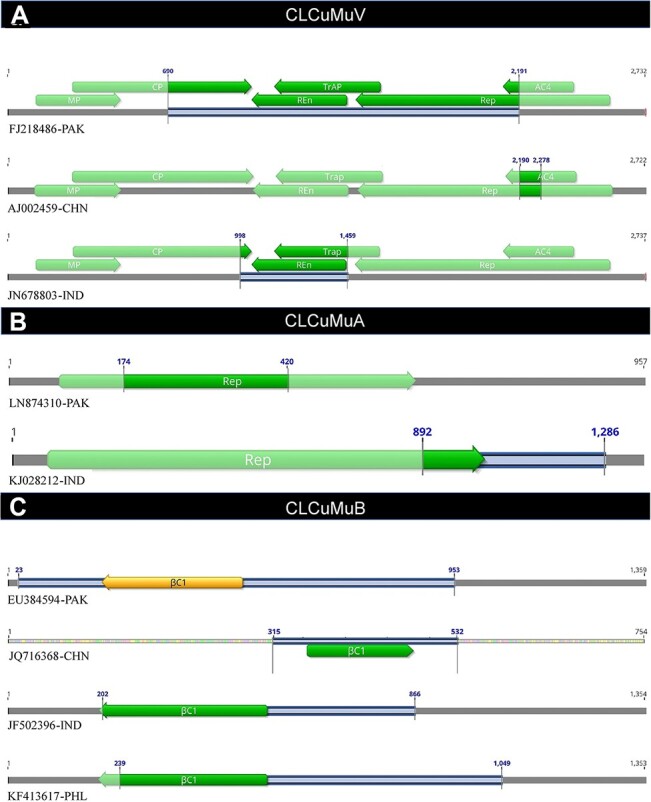
Figure 5.

Patterns of most frequently detected recombination breakpoints distributed among populations of (A) CLCuMuV, (B) CLCuMuA, and (C) CLCuMuB. Each line represents a recombinant isolate and the genome area exhibiting recombination is highlighted by blue lines.
