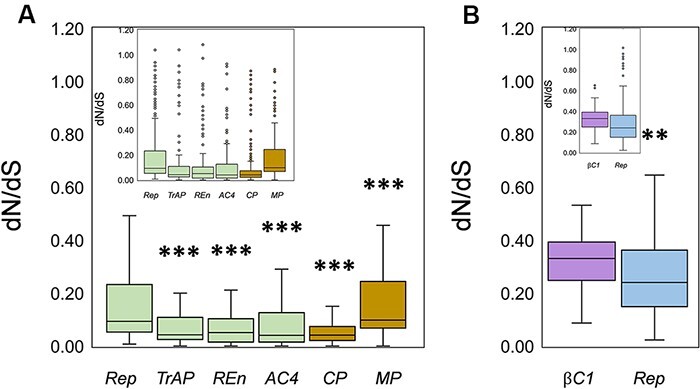
Figure 6.

Estimation of selection pressure was performed by calculation of non-synonymous to synonymous substitution ratios (dN/dS). Box plots correspond to (A) dN/dS ratio calculated for the CLCuMuV-encoded genes on the complementary sense strand (Rep, TrAP, Ren, and AC4) and virion sense strand (CP and MP), (B) dN/dS ratio for CLCuMuB-encoded βC1 gene and CLCuMuA-encoded Rep gene. The horizontal lines inside the box represent the median values, while inset displays the data with outliers denoted by small circles. Asterisks represent significance: **P < 0.01; ***P < 0.001.
