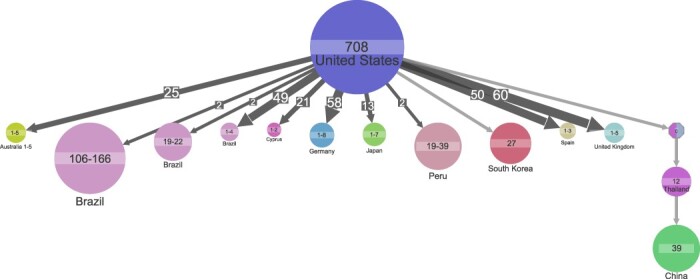
Figure 2.

Ancestral state reconstruction of 3,155 subtype B samples. Ancestral state reconstruction of samples is shown for country origin. Circles denote genetic clusters of samples with the same state. The state and sample size of clusters are indicated for each circle. An arrow between two circles denotes events of transmission from the top cluster to the bottom cluster. The size and the number on top of the arrows indicate that the arrows represent multiple transmission events leading to clusters of similar sizes. Clusters with a ‘0’ and multiple colors indicate that several corresponding states have similar marginal probabilities. The lowest marginal probability for resolved clusters shown is 74 per cent. Clusters of size less than 19 are hidden to improve readability.
