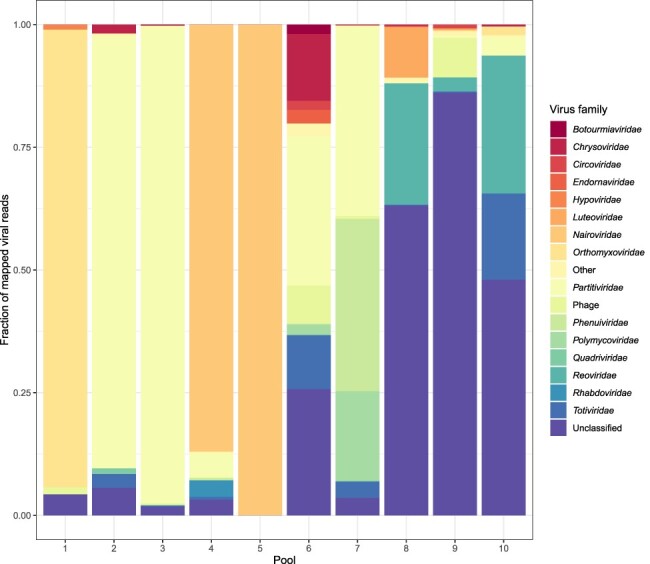
Figure 3.

Abundance of viral families in the different Illumina pools. Fraction of mapped viral reads per pool, colour-coded based on the taxonomical classification (according to KronaTools) of the closest available reference, as determined by DIAMOND. Virus families representing <1 per cent of the virus reads in a sample are grouped as ‘Other’. Virus families known to be families of bacteriophages are grouped together as ‘Phage’, as they are unlikely to represent true tick-associated viruses.
