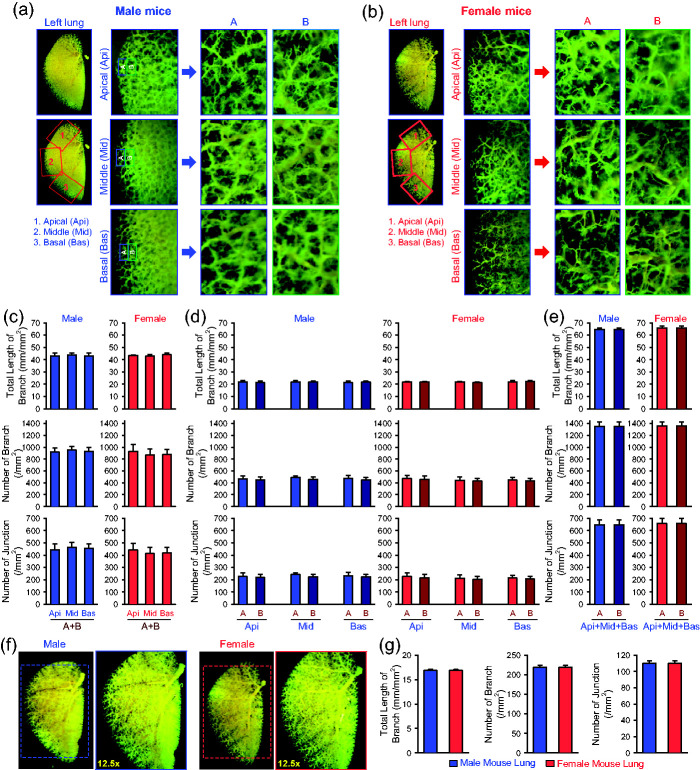
Fig. 3.
Comparison of angiography parameters in different peripheral regions of the lung between male and female mice. (a and b) Representative angiograph images of the whole left lung at 8× magnification and the peripheral regions of the apical (Api, 1), middle (Mid, 2), and basal (Bas, 3) areas of the left lung at 30× magnification (left panels) from male (a) and female (b) mice. Enlarged angiograph images of the labeled Api, Mid and Bas areas (30×) depicting the most peripheral region (A) and the adjacent region (B) from male (a) and female (b) mice. (c and e) Summarized data (mean ± SE, n = 9) showing the total length of lung vascular branches (upper panels), the number of lung vascular branches (middle panels) and the number of lung vascular branch junctions (lower panels) per square millimeter from the selected Api, Mid and Bas lung areas (c), the selected most peripheral areas (A) and adjacent peripheral areas (B) in the Api, Mid and Bas lung regions (d), and the combined (A+B) peripheral areas in the Api, Mid and Bas lung regions (e) from normal male (blue) and female (red) mice. (f) Representative angiograph images showing the whole left lung at 8× and 12.5× magnification from male (left panels) and female (right panels) mice. (g) Summarized data (mean ± SE, n = 9) showing the total length of lung vascular branches (left panel), the number of lung vascular branches (center panel) and the number of lung vascular branch junctions (right panel) per square millimeter of the whole-lung images from normal male (blue) and female (red) mice.

