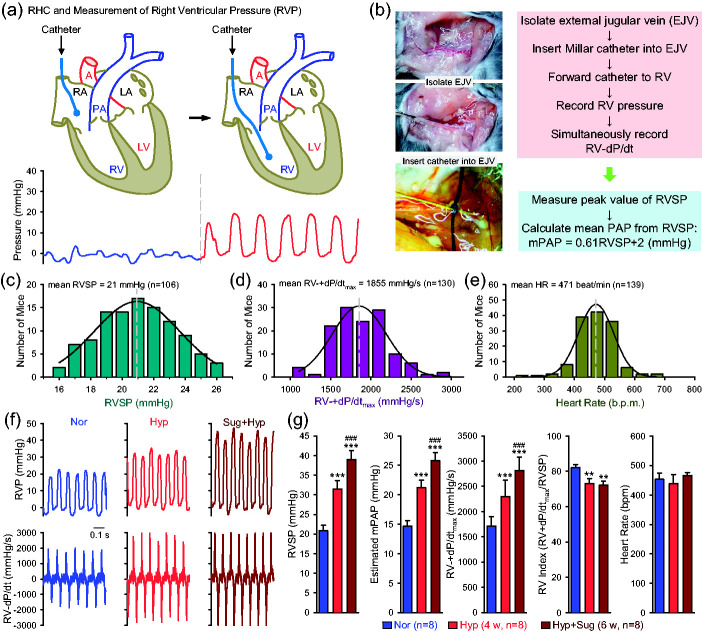
Fig. 6.
Right heart catheterization in mice to measure pulmonary hemodynamics. (a) A diagram showing the position of catheter in the right atria (RA) and right ventricle (RV) (upper panels) as well as the respective record of RA pressure (blue) and RV pressure (red) (lower panel). (b) Images of external jugular vein (EJV) and simplified protocol to measure RV pressure (RVP) and RV contractility (RV ± dP/dt). The mean pulmonary artery pressure (mPAP) is calculated from RV systolic pressure (RVSP) using the following equation: mPAP = 0.61 × RVSP + 2 (mmHg). (c–e) Histograms showing the distribution of the values of RVSP (c, n = 106), RV ± dP/dtmax (d, n = 130), and heart rate (HR, e, n = 139) in normal mice. Mean RVSP (21 mmHg), RV ± dP/dtmax (1855 mmHg/s) and HR (471) shown in the graphs are the maximal or peak values of the fitted curves, as indicated by vertical broken lines. (f) Representative records of RV pressure (RVP, upper panels) and RV contractility (RV ± dP/dt, lower panels) in normoxic (Nor), chronically hypoxic (Hyp, for four weeks) and sugen/hypoxia (Sug+Hyp, for six weeks) mice. (g) Summarized data (mean ± SE, n = 8) showing RVSP, estimated mPAP, RV ± dP/dtmax, calculated RV contractile index (the ratio of RV ± dP/dtmax to RVSP), and HR in Nor, Hyp and Sug+Hyp mice. **p < 0.01, ***p < 0.001 vs. Nor; ###p < 0.001 vs. Hyp (one-way ANOVA).

