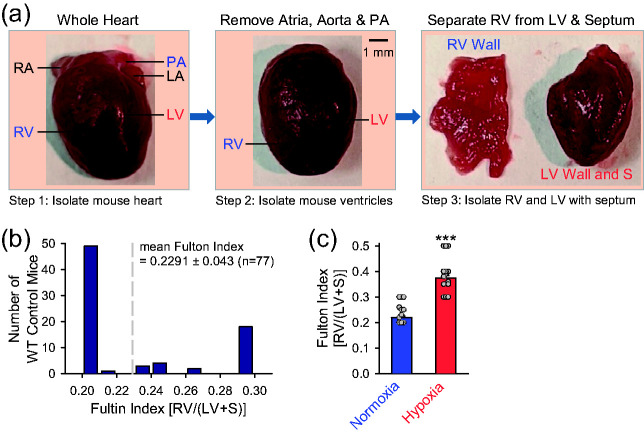
Fig. 8.
Fulton index is increased in chronically hypoxic mice. (a) Experimental diagram depicting the isolated whole heart (left), the ventricles without the main PA, aorta and atria (middle), and the isolated RV (right). (b) Histogram of Fulton index, the ratio of the weight of RV to the weight of the left ventricle (LV) and septum (S) [RV/(LV+S)]. (c) Summarized data (means±SE) showing Fulton Index [RV/(LV+S)] (left panel) in normoxic control mice (Normoxia, n = 50) and chronically hypoxic mice (Hypoxia, n = 30). ***p < 0.001 vs. Normoxia.

