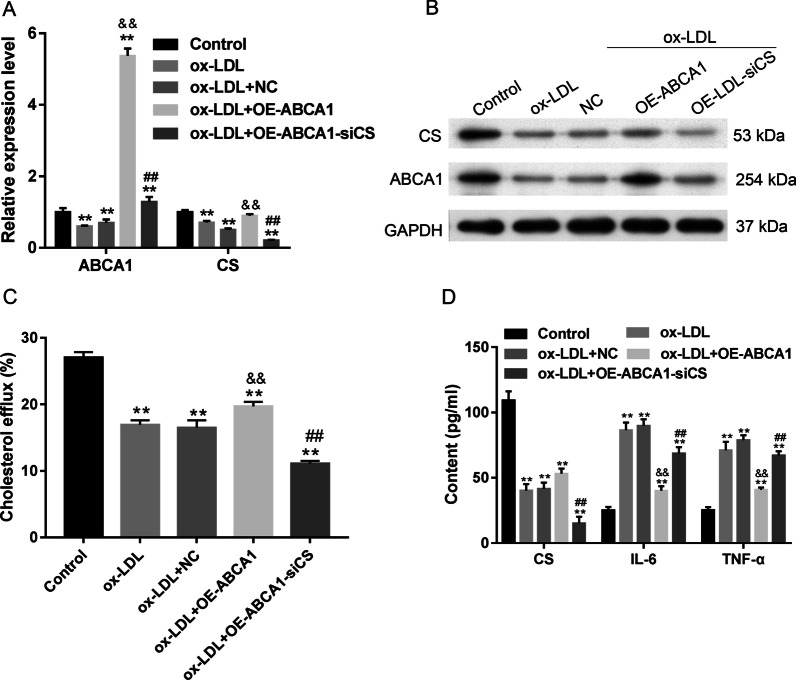
Fig. 8.
Antagonistic effect of CS overexpression on ABCA1 inhibition. A, B the levels of ABCA1 and CS mRNA and protein expression in response to transfections. The original bands of WB are presented in Additional file 1: [2C]. C the cellular cholesterol efflux from VECs. D the levels of cellular CS, IL-6, and TNF-α in VECs. Ox-LDL, oxidized low-density lipoprotein. NC, overexpression negative control. **p < 0.01 vs. control by one-way ANOVA followed by Tukey's post hoc test. &&p < 0.01 vs. ox-LDL by one-way ANOVA followed by Tukey's post hoc test. ##p < 0.01 vs. OE-ABCA1 by one-way ANOVA followed by Tukey's post hoc test. The above experiments were repeated three times and the mean value was obtained

