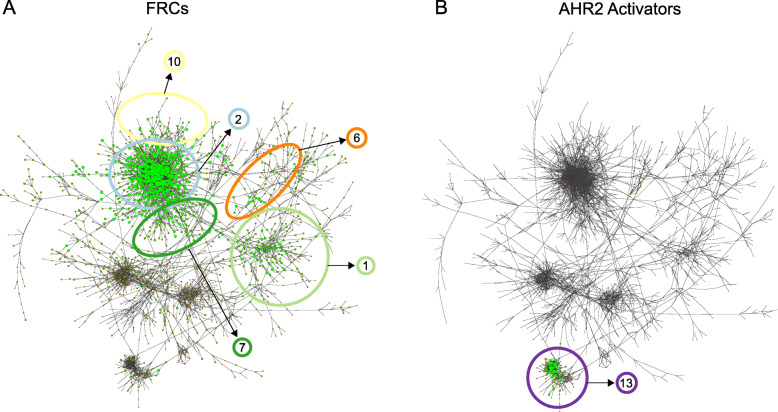
Fig. 3.
Network response to FRCs and AHR2 Activators. A Nodes are colored and sized by the number of FRCs they respond to (defined as an FDR p-value < 0.05 when comparing chemical to DMSO control, no fold-change cutoff). Larger green nodes respond to a more chemicals, smaller brown nodes respond to fewer chemicals. General location of modules highly associated with FRCs (Modules 1, 2, 6, 7, and 10) are indicated. B Same as (A) but showing response to AHR2 Activators. Location of Module 13, highly associated with the AHR2 Activators, is indicated

