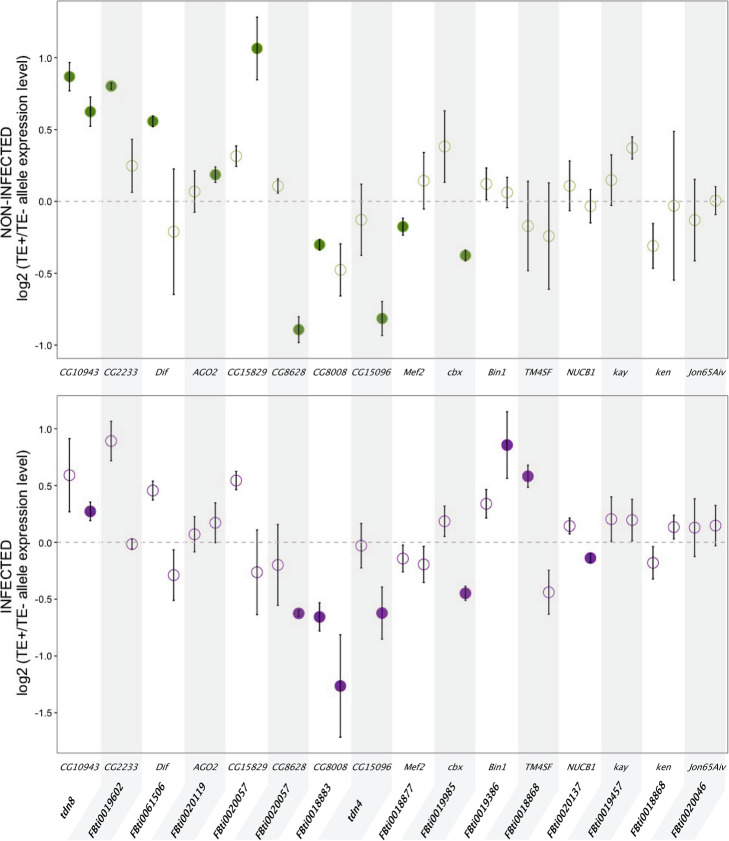
Fig. 2.
Twelve candidate immune-related TEs are associated with changes in expression of their nearby genes. Allele-specific expression results from female guts in non-infected conditions (top, green) and in infected conditions (bottom, purple). Each dot represents the average ratio of gene expression levels between the allele with the TE and the allele without the TE for the three replicates analyzed. Each gene has two dots representing each one of the two genetic backgrounds analyzed. Statistically significant differences are depicted with darker colors (t test p values < 0.05, corrected for 5% FDR). Error bars represent SEM. Note that besides being associated with lower CG8628 allele-specific expression, FBti0020057 was also associated with increased CG15829 allele-specific expression in non-infected conditions

