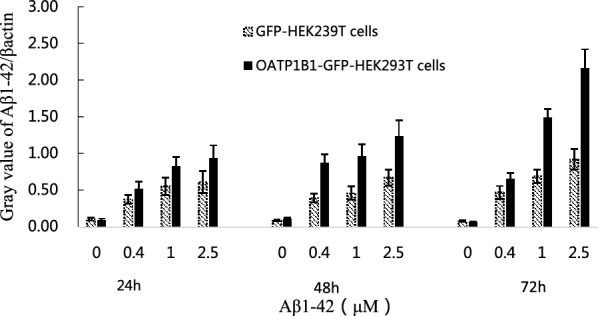
Fig. 3.

Western Blot bands were calculated and Aβ1-42/β-actin ratio value represented the indirect uptake of Aβ1-42 in the cells. The results showed that Aβ1-42 uptake in GFP-HEK293T cells and OATP1B1-GFP-HEK293T cells was 0.11 ± 0.02 vs 0.10 ± 0.02, 0.38 ± 0.06 vs 0.52 ± 0.10, 0.56 ± 0.12 vs 0.83 ± 0.13, 0.62 ± 0.15 vs 0.93 ± 0.18 when the cells were treated with Aβ1-42 (0, 0.4, 1, 2.5 μM) for 24 h, while they were 0.09 ± 0.01 vs 0.12 ± 0.01, 0.40 ± 0.06 vs 0.87 ± 0.12, 0.46 ± 0.09 vs 0.97 ± 0.16, 0.68 ± 0.11 vs 1.24 ± 0.21 for 48 h, and 0.08 ± 0.01 vs 0.07 ± 0.01,0.47 ± 0.09 vs 0.66 ± 0.08,0.69 ± 0.09 vs 1.49 ± 0.11,0.92 ± 0.14 vs 2.16 ± 0.26 for 72 h
