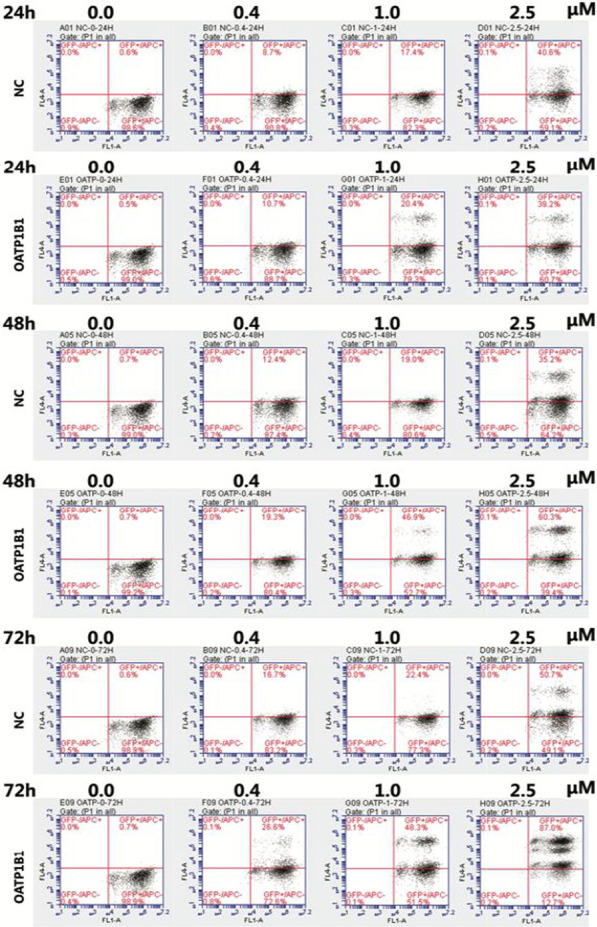
Fig. 4.

In the flow cytometry diagram, GFP fluorescence of cells was detected by transverse FL1A channel, and Aβ 1–42 Label fluorescence was detected by longitudinal FL4A channel. The double positive cells in the upper right quadrant were HEK293T cells successfully carrying GFP and ingesting Aβ1-42. By calculating the proportion of double positive cells in the upper right quadrant, the proportion of cells in each group that ingested Aβ1-42 was obtained (Fig. 4 and Table 1). By calculating the fluorescence intensity of Aβ1-42 in the double positive cells in the upper right quadrant, the relative amount of A β1-42 ingested in each group of cells was obtained (shown in Fig. 5 and Table 2). NC:GFP-HEK293T cells; OATP1B1: OATP1B1-GFP-HEK293T cells
