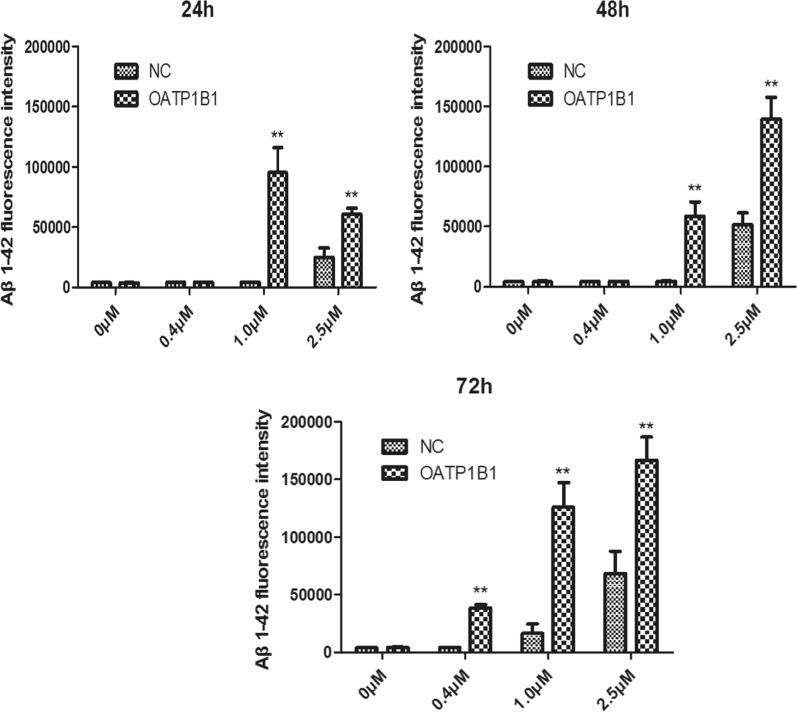
Fig. 6.
Fluorescence intensity of Aβ1-42 in the GFP-HEK293T cells and OATP1B1-GFP-HEK293T cells. The fluorescence intensity of Aβ 1–42 in OATP1B1-GFP-HEK293T cells was apparently higher than that in the GFP-HEK293T cells when the cells were treated with 1.0 and 2.5 μM Aβ1-42 during the incubation time of 24–72 h. Especially, as the duration of incubation increased to 72 h, the fluorescence intensity of Aβ 1–42 in OATP1B1-GFP-HEK293T cells was significantly higher than that in the GFP-HEK293T cells in the concentration range of 0.4–2.5 μM. *indicates P < 0.05; **indicates P < 0.01. NC:GFP-HEK293T cells; OATP1B1:OATP1B1-GFP-HEK293T cells. n = 3

