
Fig. 1. Scalable in vivo metastatic potential mapping with barcoded cell line pools.
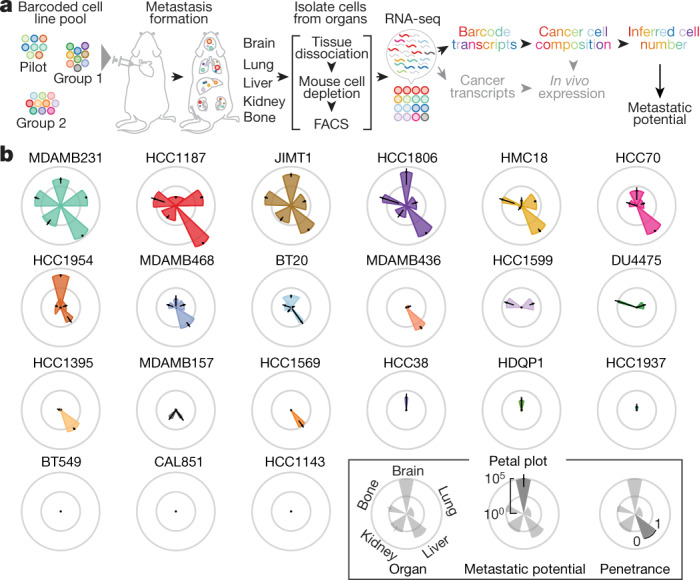
a, A schematic of the experiment determining the feasibility of in vivo metastatic potential profiling using barcoded cell line pools. Barcode abundance reflecting cancer cell compositions was determined by RNA-seq, and the cell number of each cell line was inferred by cancer cell composition and total cancer cell counts isolated from the target organ. b, Petal plots displaying the metastatic patterns of 21 basal-like breast cancer cell lines. Petal length represents metastatic potential, quantifying the mean of inferred cancer cell numbers detected from the target organs. Data are mean ± 95% confidence interval. Petal width shows penetrance, quantifying percentage of mice detected with the cell line.