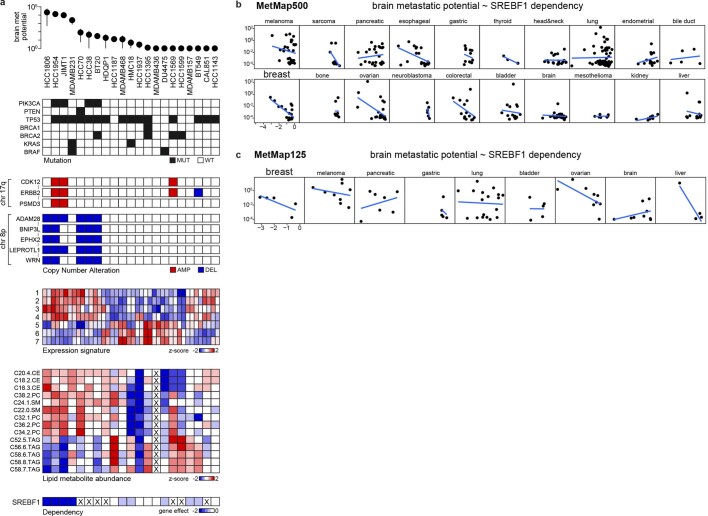
Extended Data Fig. 5. Genetic correlates of brain metastatic potential in basal-like breast cancer.
a. A line-by-line view of brain metastatic potential and its associated features at genetic, expression, metabolite, and gene dependency levels. Mutation: mutant (MUT), wild-type (WT). Copy number: data are binarized, with deletion (DEL) cutoff < = -1 and amplification (AMP) cutoff > = 1. Expression signatures: 1. Hallmark: PI3K/AKT/MTOR signalling, 2. GO: ERBB signalling pathway, 3. GO: ERBB2 signalling pathway, 4. Burton: adipogenesis peak at 8hr, 5. GO: carnitine metabolic process, 6. Reactome: mitochondrial fatty acid beta oxidation, 7. GO: short chain fatty acid metabolic process. Data not available for the cell lines are marked with X. b, c, Scatter plots showing the correlation of SREBF1 in vitro dependency and brain metastatic potential in MetMap500 (a) and MetMap125 (b). Strong inverse correlation was observed for breast cancer in both datasets. Each dot represents a cell line.

