
Fig. 3. Clinical correlates of metastatic potential.
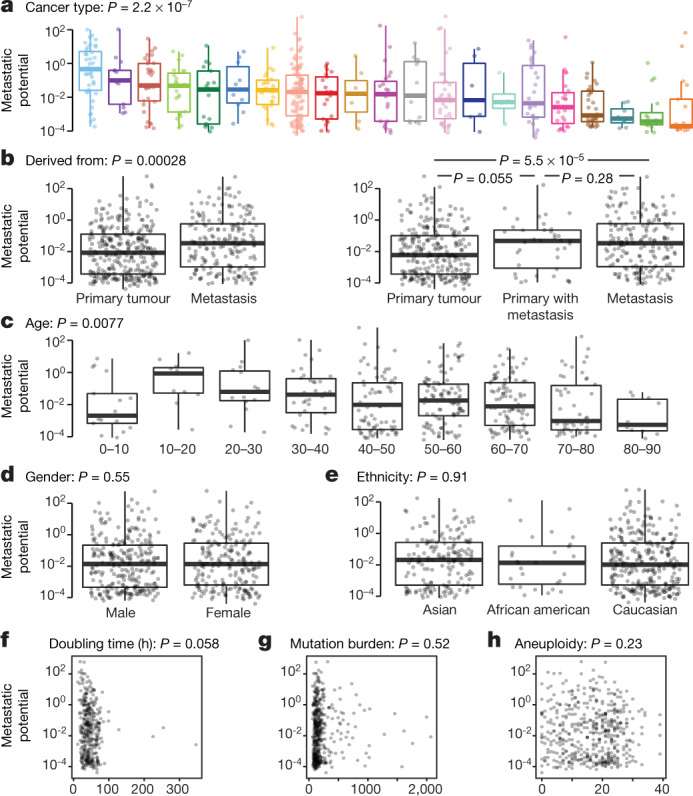
a–e, Single-variate correlation of different clinical parameters with overall metastatic potential from MetMap500 data. Primary with metastasis indicates that the cell line was derived from the primary tumour and the donor developed metastasis at diagnosis or later. In box plots, boxes display quartiles of the data; outlier points extend beyond 1.5× interquartile ranges from either hinge. Cancer lineage is colour-coded as in Fig. 2a. f–h, Single-variate correlation of cell doubling, mutation burden and aneuploidy status with overall metastatic potential from MetMap500 data. f, Doubling time in hours. g, Mutation burden quantified by somatic mutations from exon-sequencing data. h, Aneuploidy quantified by chromosome-arm-level events from exon-sequencing data. Each dot represents a cell line.