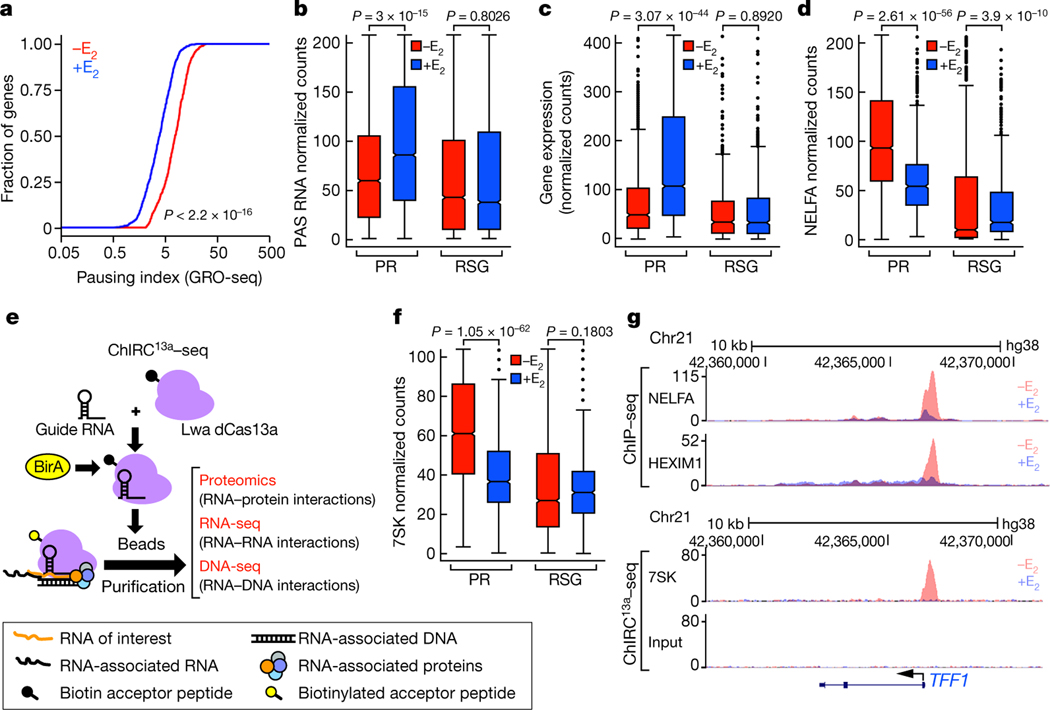
Fig. 1 |. E2 induction of Pol II pause release and PAS RNA transcription.
a, Cumulative distribution of the Pol II pausing ratio based on GRO-seq analysis (n = 3 independent experiments) for PR genes. The P value was determined by two-sided Kolmogorov-Smirnov test. b, c, Box plot analysis of GRO-seq data showing PAS RNA expression (b) and gene expression (c) at the indicated genes in response to E2. Throughout the study, we used 837 randomly selected genes (RSG) as control for box plot analysis. d, f, Box plot analysis of NELFA ChIP-seq data (d) and 7SK ChIRC13a-seq data (f) representing the effect of E2 on NELFA and 7SK binding at the indicated promoters. e, A scheme of the ChIRC13a-seq method. Lwa, Leptotrichia wadei. g, Genome browser views of the TFF1 genomic region. Chr21, chromosome 21. In b-d, f, for the box plots, the middle line denotes the median, the box represents the interquartile range and the whiskers denote 5 times the interquartile range from the upper or lower quartiles (n = 2 independent experiments). The P values were determined by two-sided Wilcoxon test.

