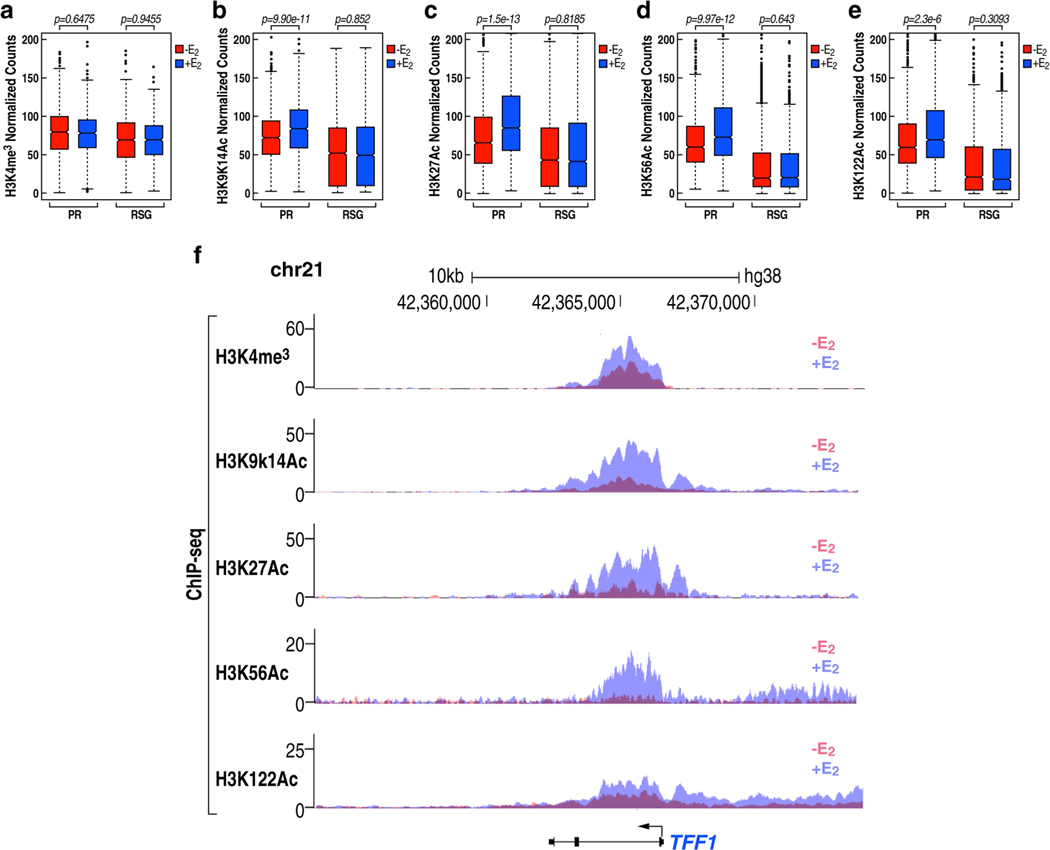
Extended Data Fig. 6 |. E2-dependent PR promoter activation.
a-e, Box plot analysis of ChIP-seq data for H3K4me3 (a), H3K9K14ac (b), H3K27ac (c), H3K56ac (d) and H3K122ac (e) at the PR and RSG promoters, in the absence or presence of E2 treatment. The box plots denote the medians, the interquartile ranges and the whiskers. Data were generated in two independent experiments. The P values were calculated with two-sided Wilcoxon test. f, Genome browser views of H3K4me3, H3K9K14ac, H3K27ac, H3K56ac and H3K122ac ChIP-seq on a selected TFF1 genomic region in the absence or presence of E2 treatment.

