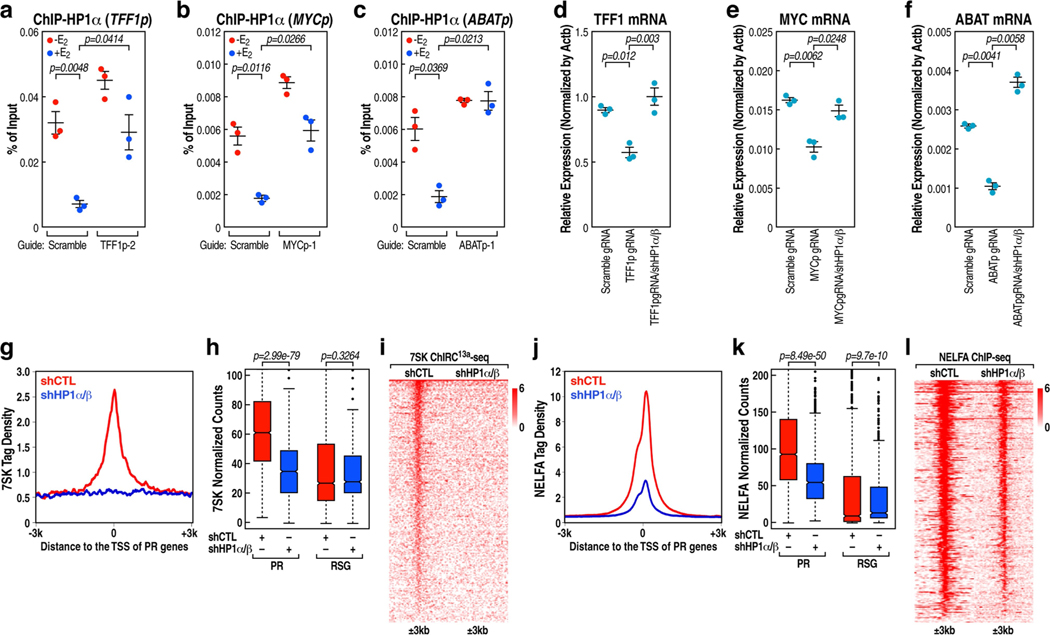
Extended Data Fig. 10 |. HP1-mediated stabilization of 7SK and NELFA at the promoter.
a-c, HP1α ChIP-qPCR data showing the effect of TFF1pasRNA (a), MYCpasRNA (b) and ABATpasRNA (c) knockdown on accumulation of HP1α on the respective cognate coding gene promoter following E2 treatment. Data shown as individual values, mean ± s.d. (n = 3). The P values were calculated with two-sided Student’s t-test. d-f, Real-time RT-PCR data showing the effect of knockdown of HP1α and HP1β in TFF1pasRNA (d), MYCpasRNA (e) and ABATpasRNA (f) knockdown MCF-7 cells by the CRISPR-Cas13a strategy on the respective cognate coding gene transcription. Data shown as individual values, mean ± s.d. (n = 3). The P values were calculated with two-sided Student’s t-test. g, j, 7SK ChIRC13a-seq (g) and NELFA ChIP-seq (j) tag distribution analysis representing the effect of HP1α and HP1β knockdown on 7SK (g) and NELFA (j) binding at the PR promoters. h, k, Box plot analysis of 7SK ChIRC13a-seq (n = 1 experiment) (h) and NELFA ChIP-seq (k) (n = 1 experiment) data representing the effect of HP1α and HP1β knockdown on 7SK (h) and NELFA (k) binding at the PR and RSG promoters. The box plots denote the medians, the interquartile ranges and the whiskers. The P values were calculated with two-sided Wilcoxon test. i, l, Heat map of 7SK ChIRC13a-seq (i) and NELFA ChIP-seq (l) data representing the effect of HP1α and HP1β knockdown on 7SK (i) and NELFA (l) binding at the PR promoters.

