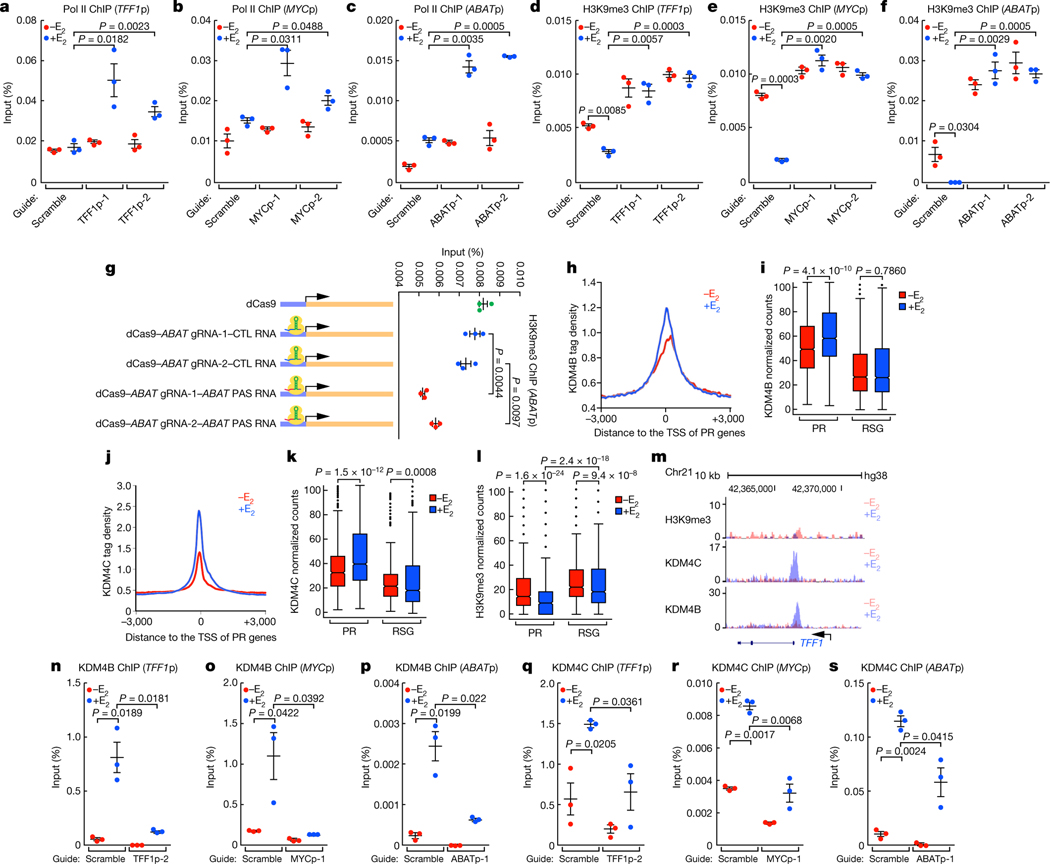
Fig. 3 |. H3K9me3 erasure at the promoter by PAS RNA.
a-f, ChIP-qPCR data showing the effect of PAS RNA knockdown on the accumulation of Pol II (a-c) and H3K9me3 (d-f) at the respective promoter. ‘p’ denotes promoter. g, ChIP- qPCR data showing the effect of tethering ABAT PAS RNA to the ABAT promoter on the accumulation of H3K9me3 at the ABAT promoter. h, j, ChIP-seq tag distribution analysis representing the effect of E2 on the binding of KDM4B (h) and KDM4C (j) at PR promoters. i, k, l, Box plot analysis representing the effect of E2 on the binding of KDM4B (i), KDM4C (k) and H3K9me3 (l) at the indicated promoters. The box plot parameters are the same as in Fig. 1 (n = 2 independent experiments). The P values were determined by two-sided Wilcoxon test. m, Genome browser views of the TFF1 promoter region. n-s, ChIP-qPCR data showing the effect of PAS RNA knockdown on the accumulation of KDM4B (n-p) and KDM4C (q-s) on the respective promoter. In a-g, n-s, data are shown as individual values, mean ± s.d. (n = 3). The P values were determined by one-sided Student’s t-test.

