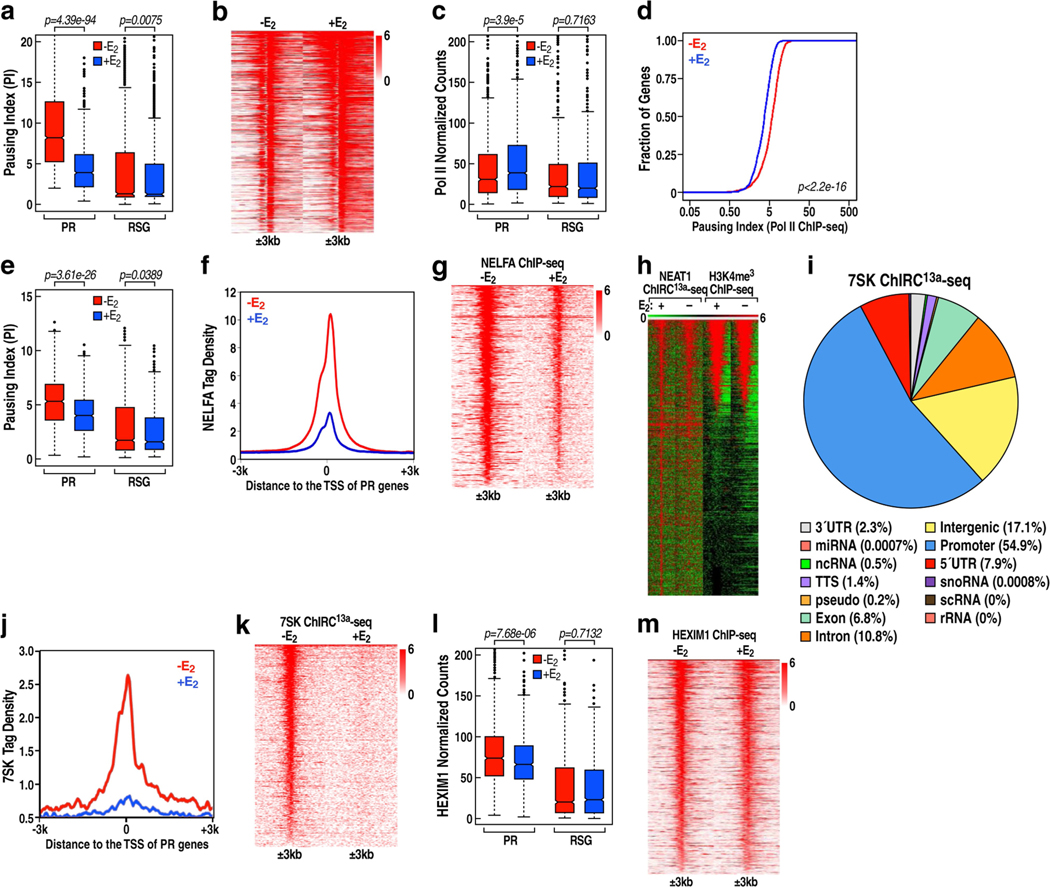
Extended Data Fig. 1 |. PAS RNA and Pol II promoter proximal pause release induced by E2.
a, Box plot analysis of the pausing ratio based on GRO-seq data set in GSE41324 (n = 3 independent experiments) for PR genes and 837 randomly selected genes (RSG), in the absence or presence of E2 treatment. We hereafter use the abbreviations ‘PR’ for ‘the 837 upregulated genes with Pol II pause release’, and ‘RSG’ for ‘the 837 randomly selected genes’. b, Heat map representation of GRO-seq (GSE41324) normalized tag counts centred on the 837 PR promoters (±3 kb) showing robust PAS RNA transcription at PR promoters induced by E2. c, Box plots analysis of Pol II ChIP-seq data representing the effect of E2 on Pol II occupancy over the gene bodies of the PR versus the gene bodies of RSG. d, Cumulative distribution of the Pol II pausing ratio based on Pol II ChIP-seq analysis for the PR genes in the absence or presence of E2 treatment. Data were generated in two independent experiments. The P value was calculated with two-sided Kolmogorov- Smirnov test. e, Box plot analysis of the pausing ratio based on Pol II ChIP-seq data for PR genes and RSG, in the absence or presence of E2 treatment. f, ChIP-seq tag distribution analysis representing the effect of E2 on NELFA binding at the promoters of PR genes. g, Heat map of NELFA ChIP-seq analysis representing the effect of E2 on NELFA binding at the promoters of PR genes. h, Heat map of NEAT1 ChIRC13a-seq showing a subset of NEAT1 binding sites marked with promoter mark H3K4me3, revealing that lncRNA NEAT1 localized to approximately 603 promoters in the absence of E2 treatment. i, Genomic distribution of 7SK snRNA in the basal (-E2) condition. Consistent with 7SK function regulating promoter-proximal pausing of Pol II, a large number of 7SK binding sites were localized on the promoter region of a large set of genes (n = 6,885, about 54.9% of its total binding sites). Unexpectedly, a large number of 7SK binding sites were also found to be located on intronic (n = 1,351, about 10.8% of its total binding sites) and intergenic (n = 2,144, approximately 17.1% of its total binding sites) regions. j, ChIRC13a-seq tag profile representing the effect of E2 treatment on 7SK binding at PR promoters. k, Heat map of 7SK ChIRC13a-seq analysis representing the effect of E2 on 7SK binding at the promoters of PR genes. l, Box plot analysis of HEXIM1 ChIP-seq data representing the effect of E2 on HEXIM1 binding at PR promoters and RSG promoters. m, Heat map of HEXIM1 ChIP-seq data representing the effect of E2 on HEXIM1 binding at the PR promoters. In a, c, e, l, the box plots denote the medians, the interquartile ranges and the whiskers. Data were generated in two independent experiments. The P values were calculated with two-sided Wilcoxon test.

