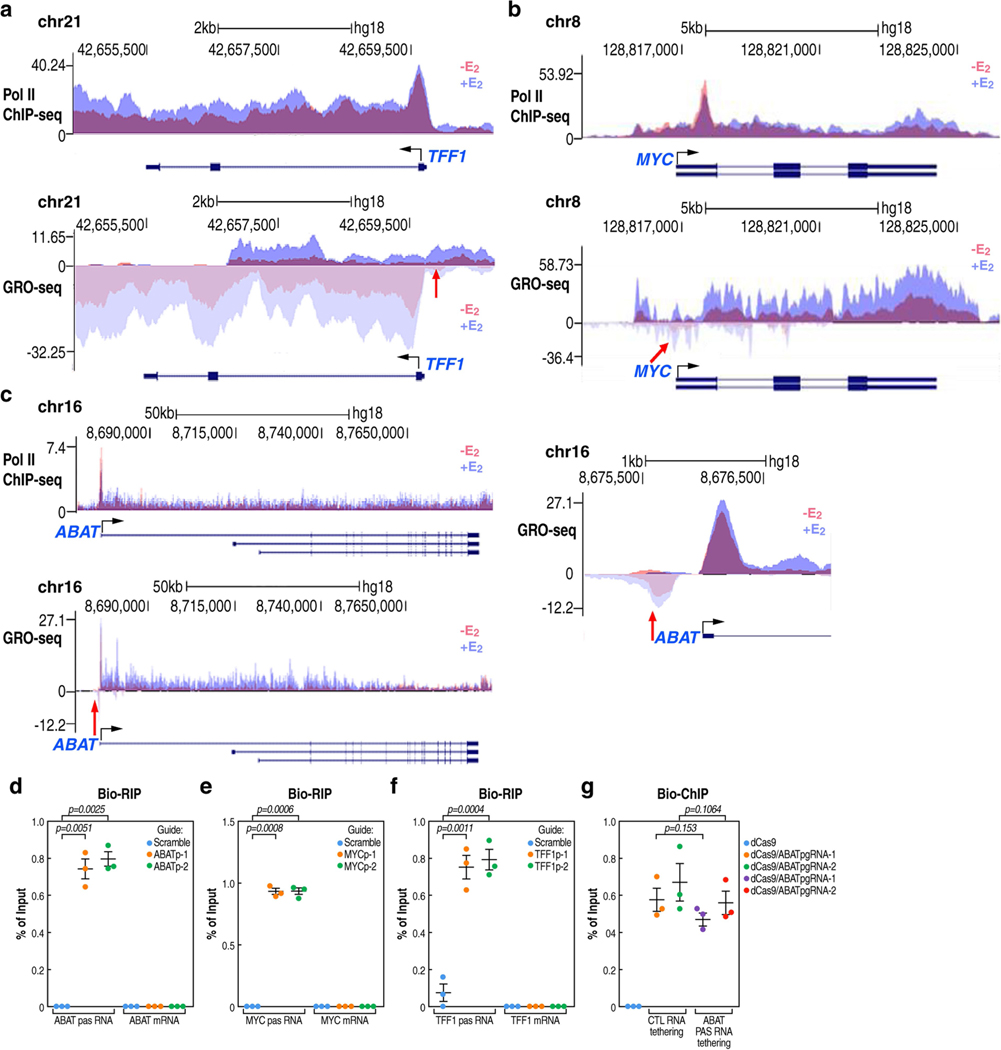
Extended Data Fig. 3 |. Specificity of CRISPR-Cas13a-based PAS RNA degradation.
a-c, Genome browser views of Pol II ChIP-seq and GRO-seq on TFF1 (a), MYC (b) and ABAT (c) genomic loci, in the absence or presence of E2 treatment. The red arrowhead indicates upregulation of PAS RNA. d-f, Real-time RT-PCR analysis of Bio-RIP data showing specificity of the CRISPR-Cas13a strategy mediated ABATpasRNA (d), MYCpasRNA (e) and TFF1pasRNA (f) knockdown. Data shown as individual values, mean ± s.d. (n = 3). The P values were calculated with two-sided Student’s t-test. g, Real-time PCR analysis of Bio-ChIP data showing that PAS RNA tethering by the CRISPR-dCas9 strategy did not affect functional assembly of CRISPR-dCas9 complex at the ABAT promoter. Data shown as individual values, mean ± s.d. (n = 3). The P values were calculated with two-sided Student’s t-test.

