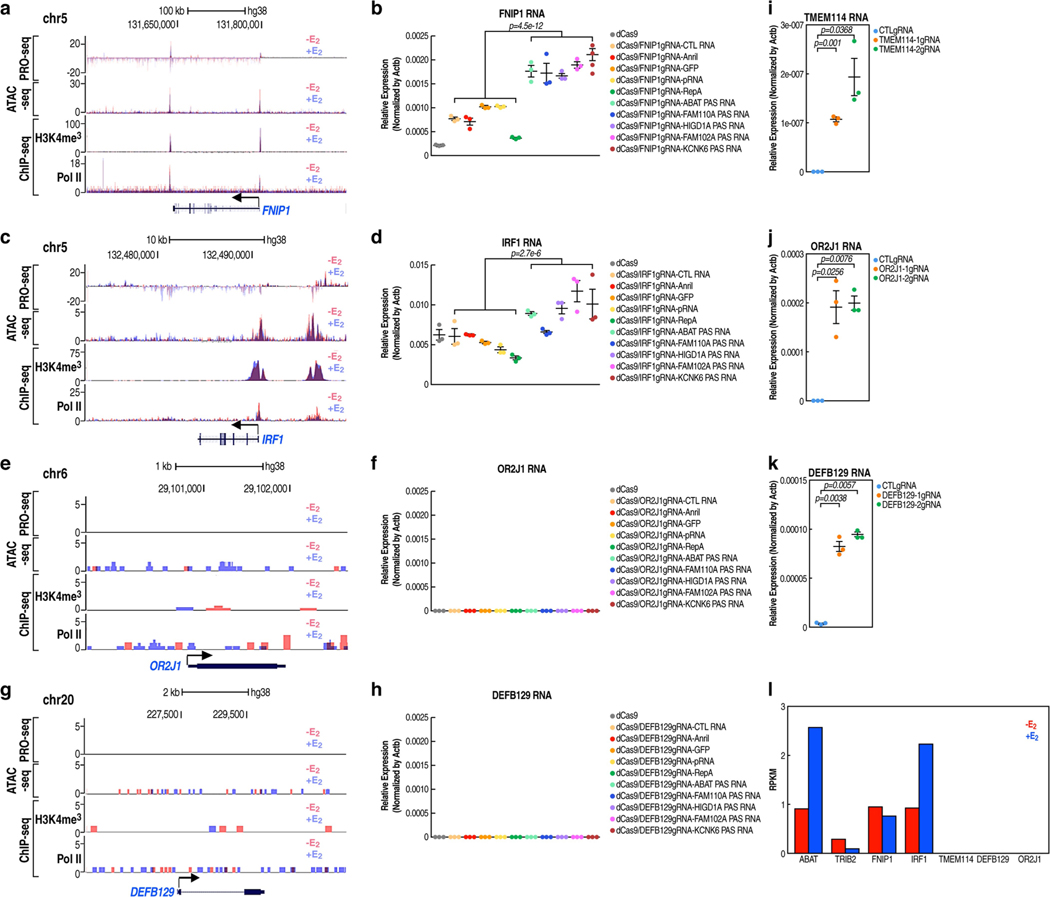
Extended Data Fig. 4 |. Context-dependent gene activation by PAS RNA tethering.
a, c, e, g, Genome browser views of ATAC-seq, PRO-seq, Pol II ChIP-seq and H3K4me3 ChIP-seq on selected FNIP1 (a), IRF1 (c), OR2J1 (e) and DEFB129 (g) genomic regions in the absence or presence of E2 treatment. b, d, f, h, Real-time RT-PCR data showing the effect of tethering a serial of pasRNAs or control RNAs to the FNIP1 (b), IRF1 (d), OR2J1 (f) and DEFB129 (h) promoters on the respective coding gene expression in the -E2 condition by the CRISPR-dCas9 strategy. Data shown as individual values, mean ± s.d. (n = 3). The Shapiro-Wilk test was computed first to verify the normal distribution of the real-time RT-PCR data before P values were calculated with two-sided Welch’s t-test. i-k, Real-time RT-PCR data showing the effect of using the CRISPR-dCas9/VP64 (CRISPRa) strategy targeting the TMEM114 (i), OR2J1 (j) and DEFB129 (k) promoters on the respective coding gene expression in the -E2 condition. Data shown as individual values, mean ± s.d. (n = 3). The P values were calculated with two-sided Student’s t-test. l, Bar plot data showing the RPKM expression values of the genes to which dCas9-PAS RNAs were delivered. RPKM values were computed based on GRO-seq datasets in GSE41324 (combined replicates).

