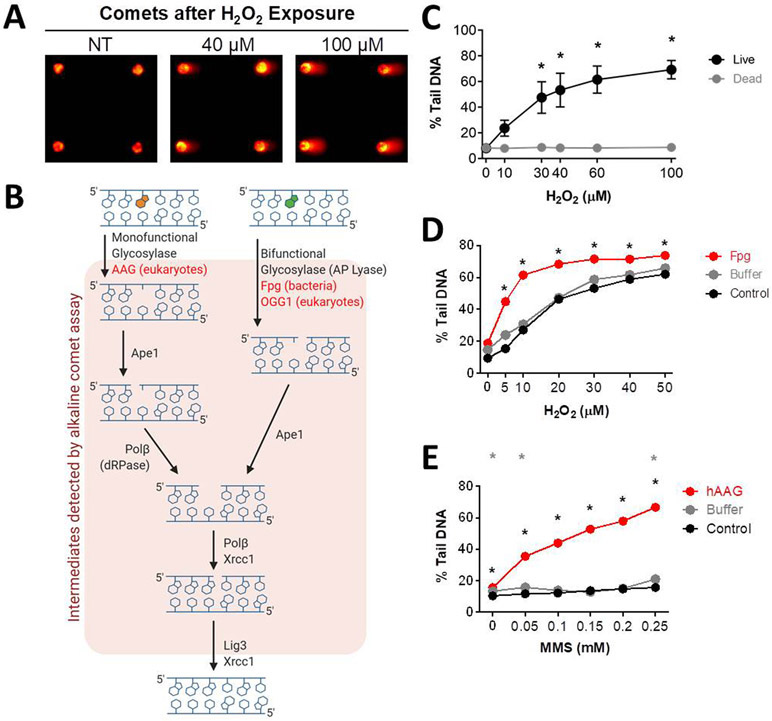
Figure 2.
Measuring DNA BER of oxidative lesions. (A) Representative arrayed comet images. (B) Schematic of the mammalian BER pathway. (C) H2O2 dose response curves when exposed to multiple doses of H2O2 for 20 min at 4°C for live and lysed (dead or non-viable) TK6 lymphoblasts. (D) H2O2 dose response curves for MCL-5 cells without Fpg, with Fpg buffer, and with Fpg enzyme + Fpg buffer. (E) MMS dose response curves for MCL-5 cells without hAAG, with hAAG buffer, and with hAAG enzyme + hAAG buffer. *p < 0.05, Student’s t-test (one-tailed, paired), comparing to WT at each time point (black stars show hAAG compared to WT, grey stars show buffer only compared to WT).

