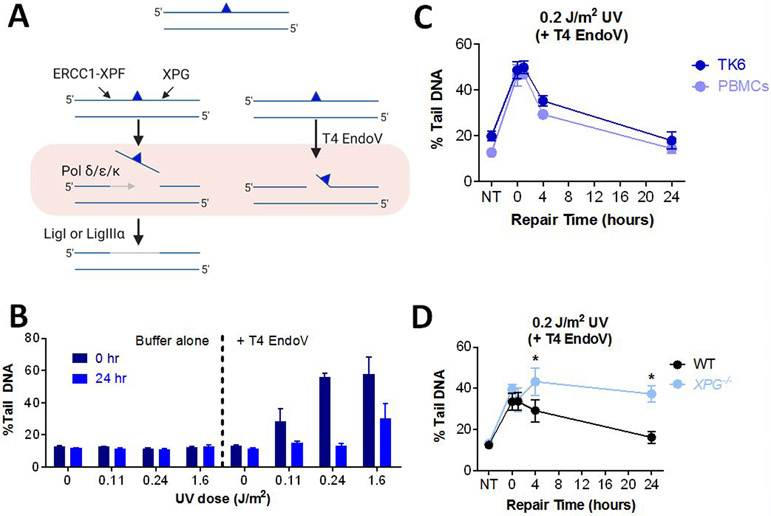
Figure 5.
Measuring DNA NER Kinetics in Live Cells. (A) Schematic of the mammalian NER pathway with the blue triangle representing a bulky lesion. (B) UV-irradiated TK6 cells were lysed overnight, and the level of CPDs was measured by incubating the exposed nuclear DNA with T4 EndoV. Buffer control is T4 EndoV reaction buffer with no enzyme added. Data points represent averages of three independent experiments. (C) TK6 and PHA-stimulated T-lymphocytes (PBMCs) after exposure to UV light. Repair was performed in media at 37°C. (D) Repair of human skin fibroblast cell lines, XPG−/− and WT. Data points represent averages of triplicate wells in one experiment. Error bars represent SEM. *p < 0.05, Student’s t-test (one-tailed, paired), comparing to WT at each time point.

