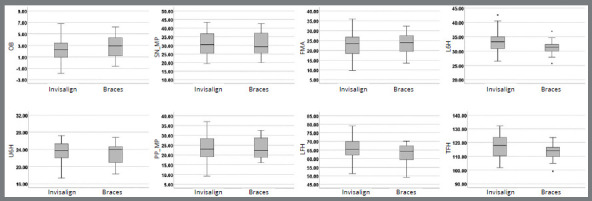
Figure 3: Box plots providing information about sample distribution, skew, and range of data for each of the eight measurements pretreatment. The upper and lower boundaries of the rectangle indicate the upper and lower quartiles, respectively. The line inside the rectangle indicates the median. The distance between the median and the quartile indicates the skew of the data. The whiskers extending from the box indicate the extreme values.