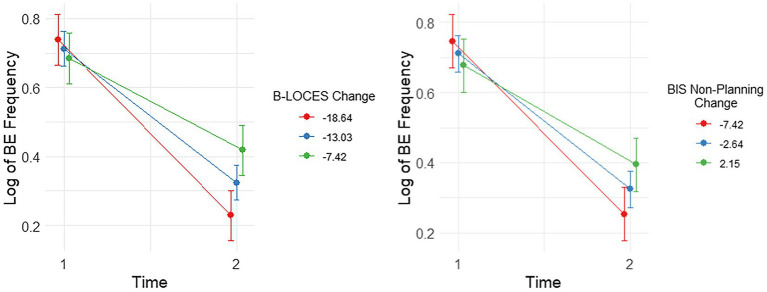
Figure 2.
Plots showing significant interactions between change in Log Binge Eating (BE) Frequency and Brief Loss of Control over Eating Scores (B-LOCES) and BIS non-planning from time 1 to 2. Following the convention suggested by Aiken and West (1991), we used the mean value of the moderators (i.e. change in BIS non-planning and B-LOCES scores) as well as one standard deviation below and above the mean value to plot the moderating effect of these measures on BE frequency between baseline and week 8.

