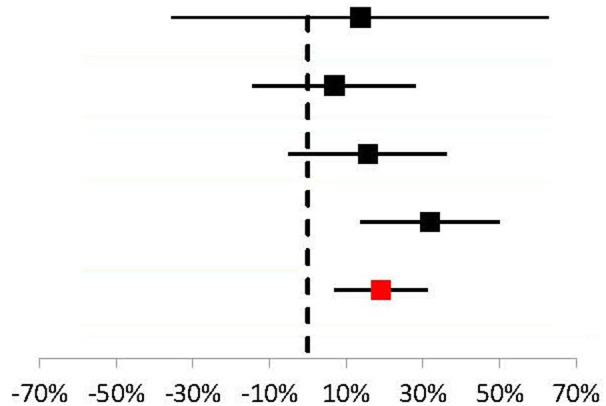
Table 3.
Meta-analysis results comparing response risk differences between TPE and IVIG in acute MG patients.
| Reference | No. of patients | Relative weight | Response Risk difference: TPE % responders–IVIG % responders | |
|---|---|---|---|---|
| Ramos-Fransi et al. (43) | 17 | 6% | 14% (95% Cl: −35%, 63%) |

|
| Barth et al. (5) | 84 | 28% | 7% (95% Cl: −14%, 28%) | |
| Gajdos et al. (41) | 87 | 29% | 16% (95% Cl: −5%, 36%) | |
| Guptill et al. (44) | 104 | 37% | 32% (95% Cl: 14%, 50%) | |
| Pooled | 292 | 19% (95% Cl: 7%, 31%) | ||
