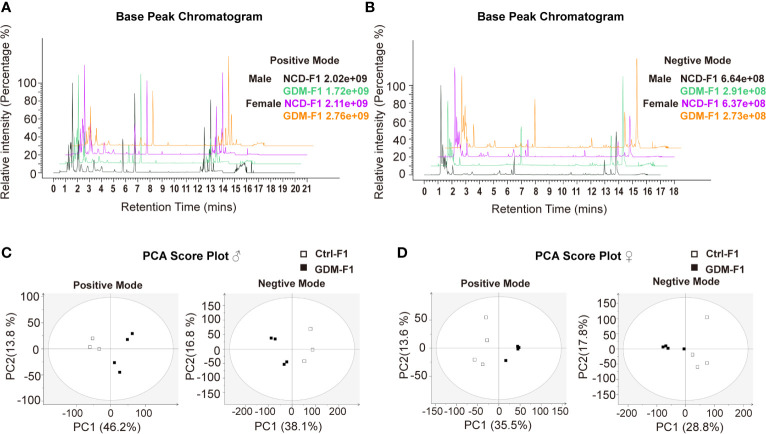
Figure 2.
BPI chromatograms and PCA score plot of UPLC-MS of fetal pancreas. (A) Representative positive BPI chromatograms of GDM-F1 and Ctrl-F1 fetal pancreas. (B) Representative negative BPI chromatograms of GDM-F1 and Ctrl-F1 fetal pancreas. (C) PCA showing clustering pattern among samples and biological replicates in male offspring. (D) PCA showing clustering pattern among samples and biological replicates in female offspring.

