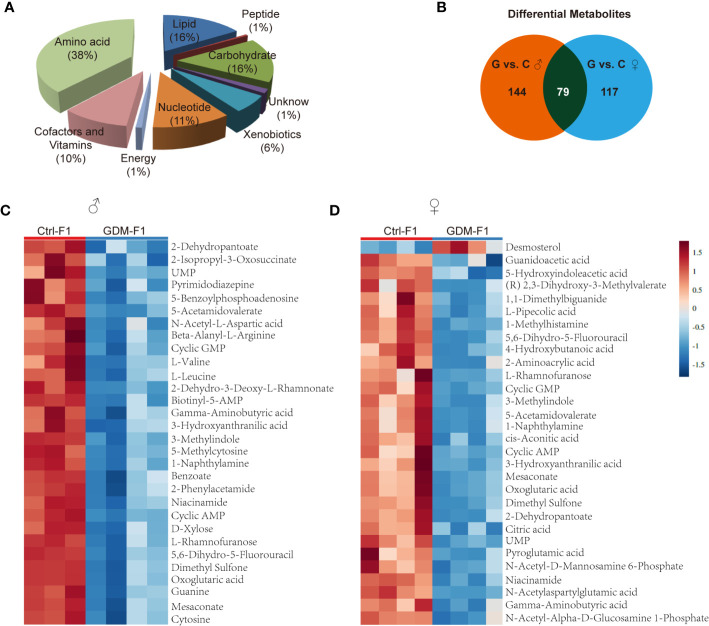
Figure 3.
Overview of the metabolome profiles in GDM fetal pancreas. (A) Classification of the detected metabolites into major functional classes. (B) Venn diagrams of different metabolites in GDM-F1 and Ctrl-F1 group and overlapped metabolites between male and female. (C) Heatmap presentation of the top 30 differential metabolites in male pancreas. (D) Heatmap presentation of the top 30 differential metabolites in female pancreas.

