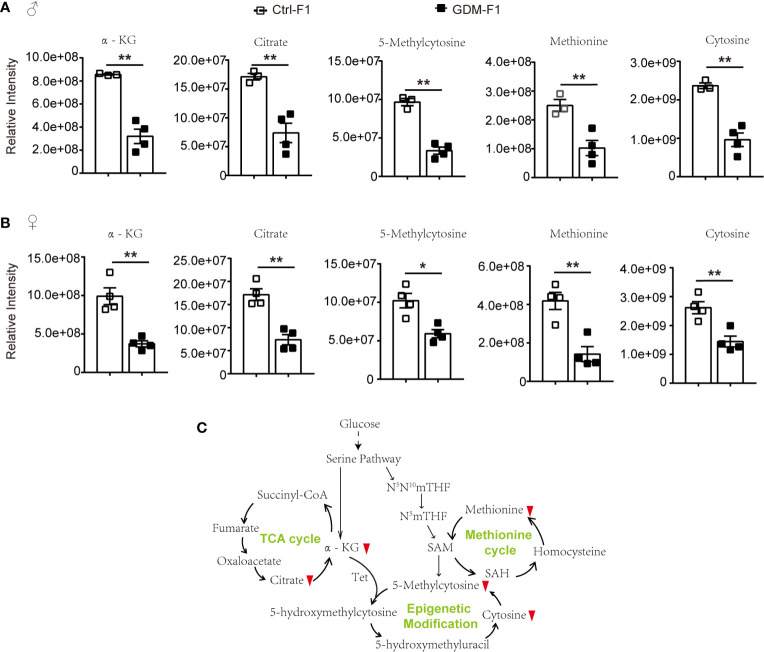
Figure 5.
The epigenetic modification related pathways and metabolites in GDM fetal pancreas. (A) Comparison of the representative intensity of metabolites related to the epigenetic modification pathway between GDM and Ctrl male fetus group. (B) Comparison of the representative intensity of metabolites related to the epigenetic modification pathway between GDM and Ctrl female fetus group. (C) The epigenetic modification related pathways in response to intrauterine hyperglycemia. The upward or downward red arrows represent an increased or decreased level of metabolites in the GDM-F1 compared with Ctrl-F1. All data were expressed as mean ± S.D. * P < 0.05 vs. Ctrl-F1; ** P < 0.01 vs. Ctrl-F1.

