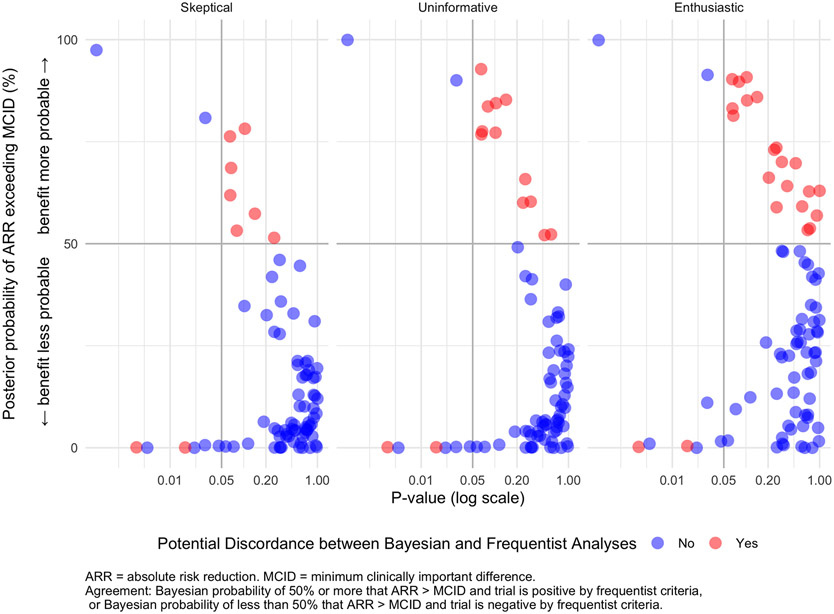
Figure 2 – Probability of Clinical Benefit Versus P-value.
This figure shows the relationship between the p-value and the posterior probability that the absolute risk reduction exceeds the minimum clinically relevant effect for each study. Each dot corresponds to a particular study. The color of the dot denotes agreement (blue) or potential disagreement (red) between frequentist and Bayesian analyses for that particular prior. Note that the blue dots in the quadrant with p-value < 0.05 and posterior probability of clinical benefit < 50% correspond to studies with p-value < 0.05 that showed harm. The posterior probability of exceeding the MCID increases as prior distributions shift from skeptical (left) to enthusiastic (right) but the p-values stay the same.

