
Figure 2.
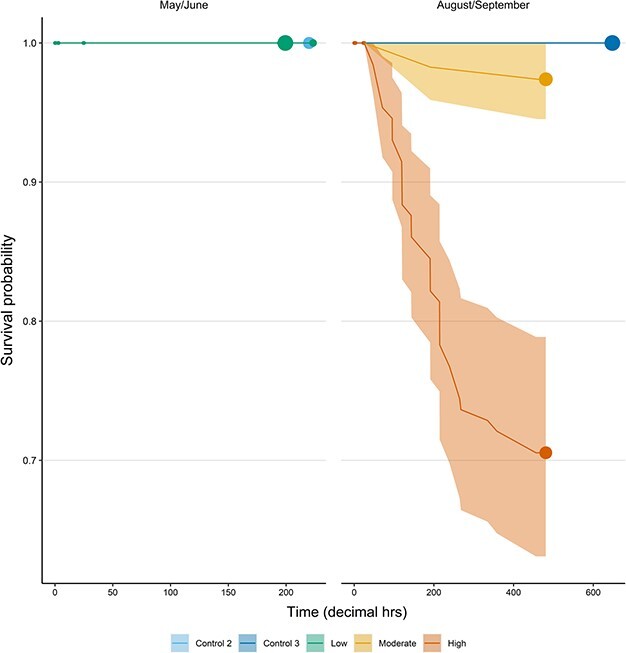
Survival responses of Atlantic mackerel to crowding in simulated trials. The fitted regressions describe the mean probability (with 95% CIs as shaded areas) of survival for the various trials, derived from the Kaplan–Meier survival function. Circles indicate the occurrence of right censored observations and are scaled in size within each plot according to the number of observations.