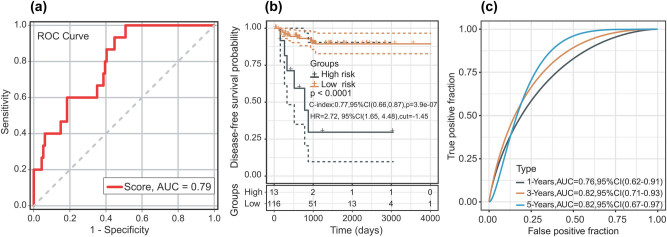
Figure 3.
(a) ROC curve of sample for male TC patients. (b) Kaplan–Meier curve after optimal cut-off value; 13 patients were placed into the high-risk group and 116 patients were placed in the low-risk group (optimal cut-off value = −1.45). (c) The AUC curve of the research subject for 1, 3, and 5 years.

