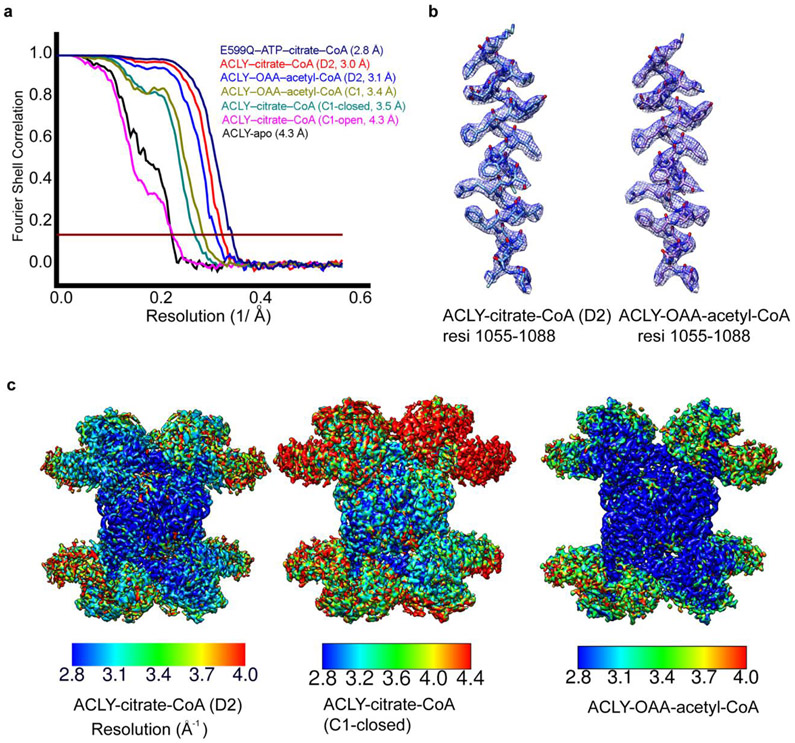
Extended Data Fig. 4.
Analysis of single particle cryo-EM reconstructions. (a) Fourier Shell Correlation (FSC) curves for 3D reconstructions of reported structures, marked with resolutions corresponding to FSC = 0.143. (b) Cryo-EM density of representative helical segments (residues 1055-1077) from ACLY–citrate–CoA (left) and ACLY–OAA–acetyl-CoA structures. (c) Local resolution estimation of cryo-EM maps of ACLY–citrate–CoA-D2 (left), ACLY–citrate-CoA-C1 asymm closed (middle) and ACLY–OAA–acetyl-CoA (right) by Resmap.

