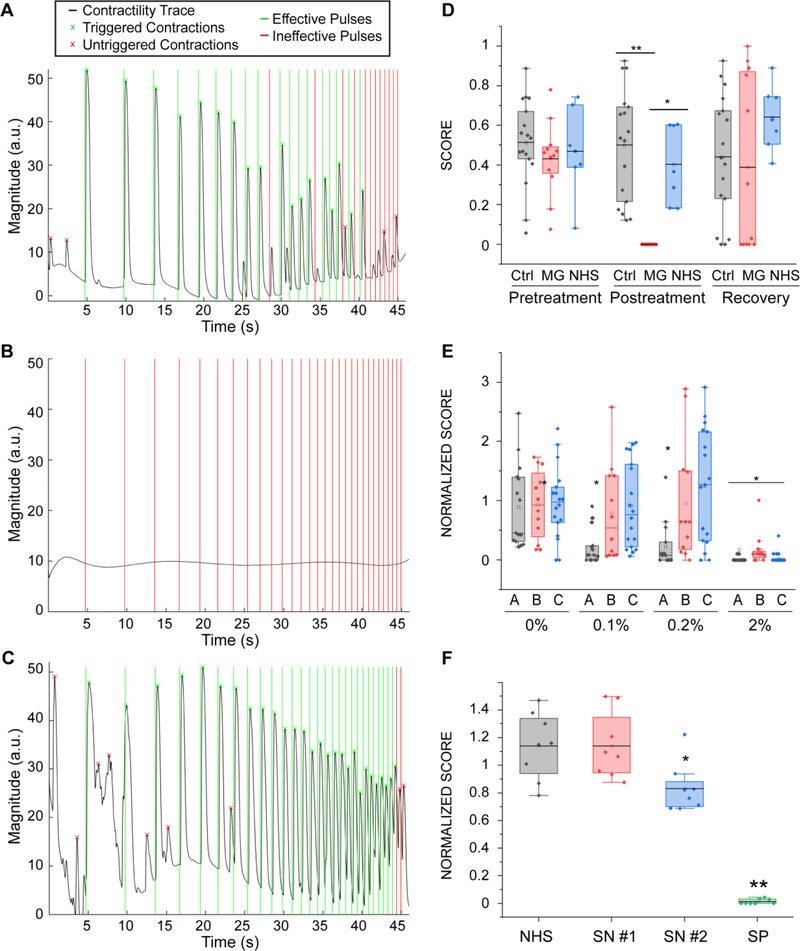
Figure 6. Myasthenia Gravis effect on NMJ function.
(A-C) Contractility traces for tissue engineered NMJs using myotubes and MNs generated from hSkM in a microfluidic platform (as depicted in Fig 1) (A) before and (B) after 48 hours of treatment with 20% of MG sera and (C) 48 hours after its removal. (D) Quantification of NMJ function of treated and control groups before and after treatment and post-recovery, (n = 12; after treatment post-hoc ANOVA F = 0.0002; *indicates p = 0.0015 **indicates p = 3.5·10−6) (MG = Myasthenia Gravis; NHS = normal human serum). (E) Effect of sera from different patients (A, B, C) on tissue function (n = 15; after treatment post-hoc ANOVA F = 2·10−5; * indicates p< 0.01 vs control group). Treatment was started on day 14 with sequential dose increments at days 16, 18 and 20 (F) Effect of IgG isolated from seronegative patients on tissue function (SN = seronegative, SP = seropositive), (n=8, *indicates p = 0.02). Boxes= 25–75 percentiles; brackets = 1.5 standard deviations. n indicates the number of biological replicates.

