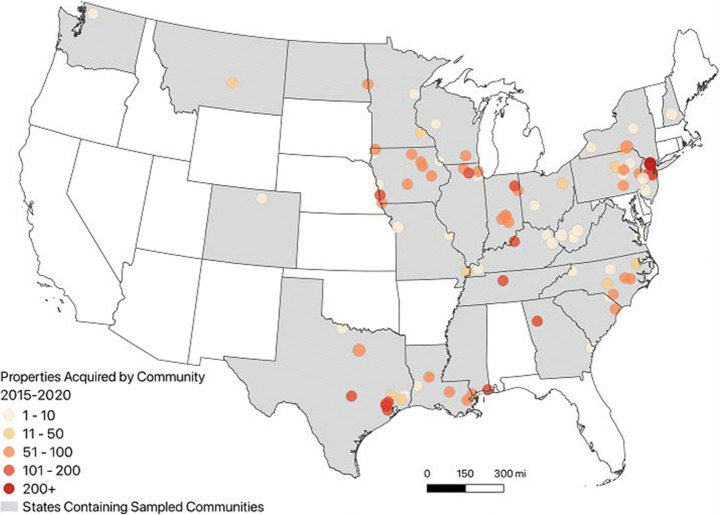
Fig. 5.
Municipalities sampled for budget review (n = 98) by number of FEMA-funded properties acquired from 2015 to 2020. Note: While all states and US territories were included in the sample frame, only the 48 conterminous states are mapped here to better represent those municipalities that were sampled

