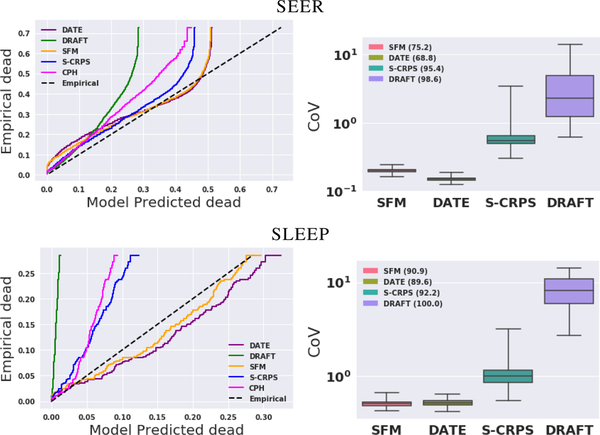
Figure 2:
Test set calibration and variation visualized for two datasets: seer and sleep (rows). Left: proportion of events of interest vs. predicted events. A perfectly calibrated model will follow the (dashed) diagonal line. Right: coefficient of variation (CoV) distributions. The legend shows the percentage of test set events covered by 95% intervals from predicted time-to-event distributions.

